November CPI data released this morning show a year over year increase of 3.14%. With Fed policy in reactive mode to inflation, such inflation reports are among the most market moving of data releases.
It’s based on fallacy.
Long time readers know one of our perennial themes is that consumer prices are a lagging indicator of inflation. I last addressed this in A Day Of Inflation. The conventional narrative is that monetary policy affects inflation, so if inflation is rising, monetary policy should tighten, and tightening monetary policy depresses asset prices. Conversely, if inflation is falling, monetary policy should ease, leading to rising asset prices.
So asset prices have nothing to do with inflation, aside from reacting to the policy response. In fact that puts a superfluous link in the chain. It is asset prices themselves, not consumer prices, that are the superior real time indicator of inflation.
First some housekeeping. There’s technical flaw in consumer inflation reporting that needs looking into. The figure that we opened with is the change in the CPI relative to the same one year prior. The rationale is that this simultaneously eliminates seasonal variations (since we’re making a comparison with the same time of year), produces a annualized figure, and covers a long enough time frame to eliminate most noise.
Fair enough, but it introduces another source of noise – the so-called “base effect”. A spike or dip in the year ago data cause a dip or spike in the reported figure even if the current monthly trajectory is smooth. It’s relatively simple to correct, but in thirty years of following financial and economic reporting I have yet to see it done.
We will do so here.
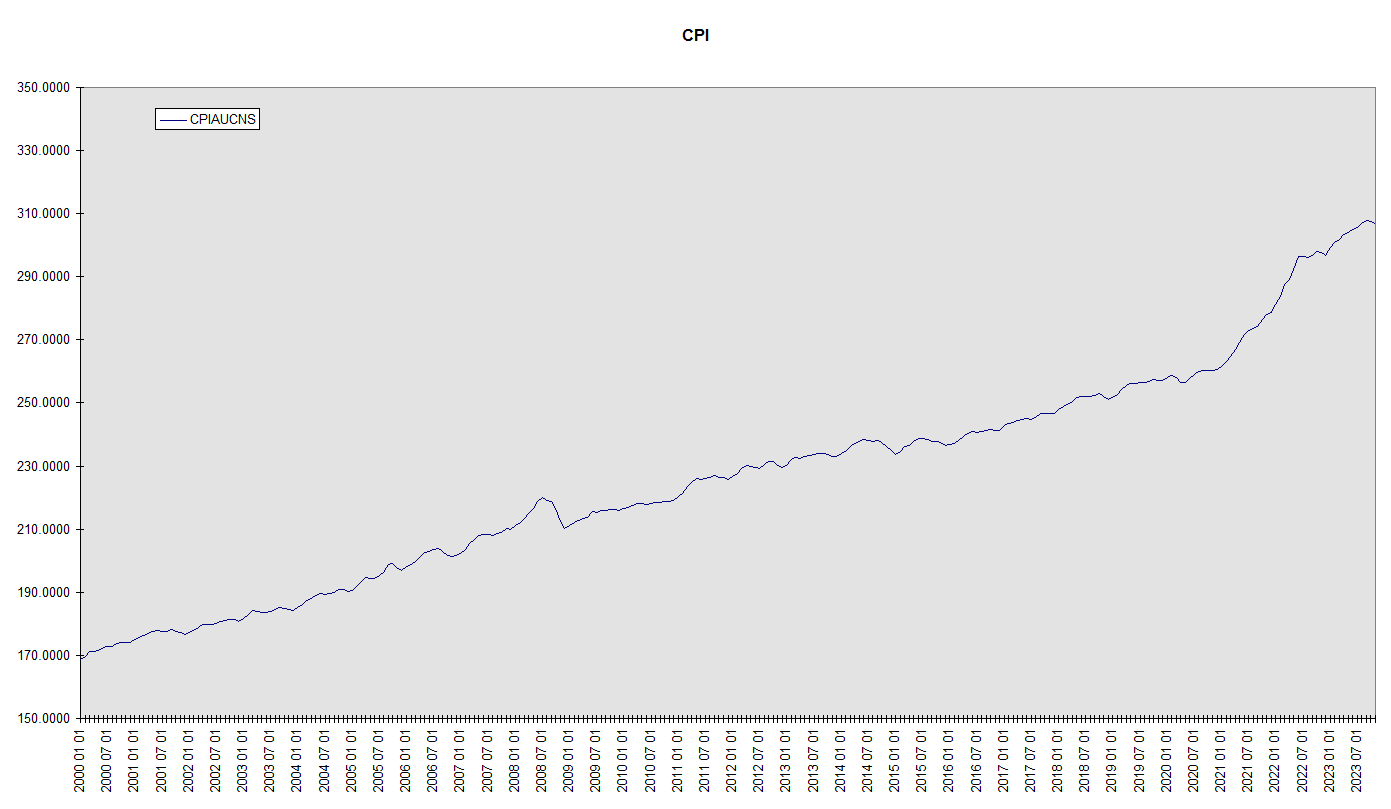
For perspective, let’s first take a look at the actual CPI itself. This is a useful exercise in itself, since this is rarely done. If you want to see what the CPI is doing, there’s nothing like looking at the CPI, free from all the media manipulation. Here CPIAUCNS stands for Consumer Price Index All Urban Consumers Not Seasonally adjusted. Data from FRED.
So how do we sidestep the base effect? Instead of comparing the latest CPI with the CPI one year ago, we compare it with its average* over the past two years. Like the year over year method, this also produces an annual rate. But unlike the simple year over year method, it also eliminates dips and spikes due to spikes and dips in the year ago data. This chart compares the two. Notice that the differences are not trivial, indicating just how much base effect noise is present in the simple year over year reporting. Plainly, reacting to any one monthly year over year report is deeply flawed. And that even assumes that the CPI itself is an accurate representation of consumer prices, a subject unto itself.
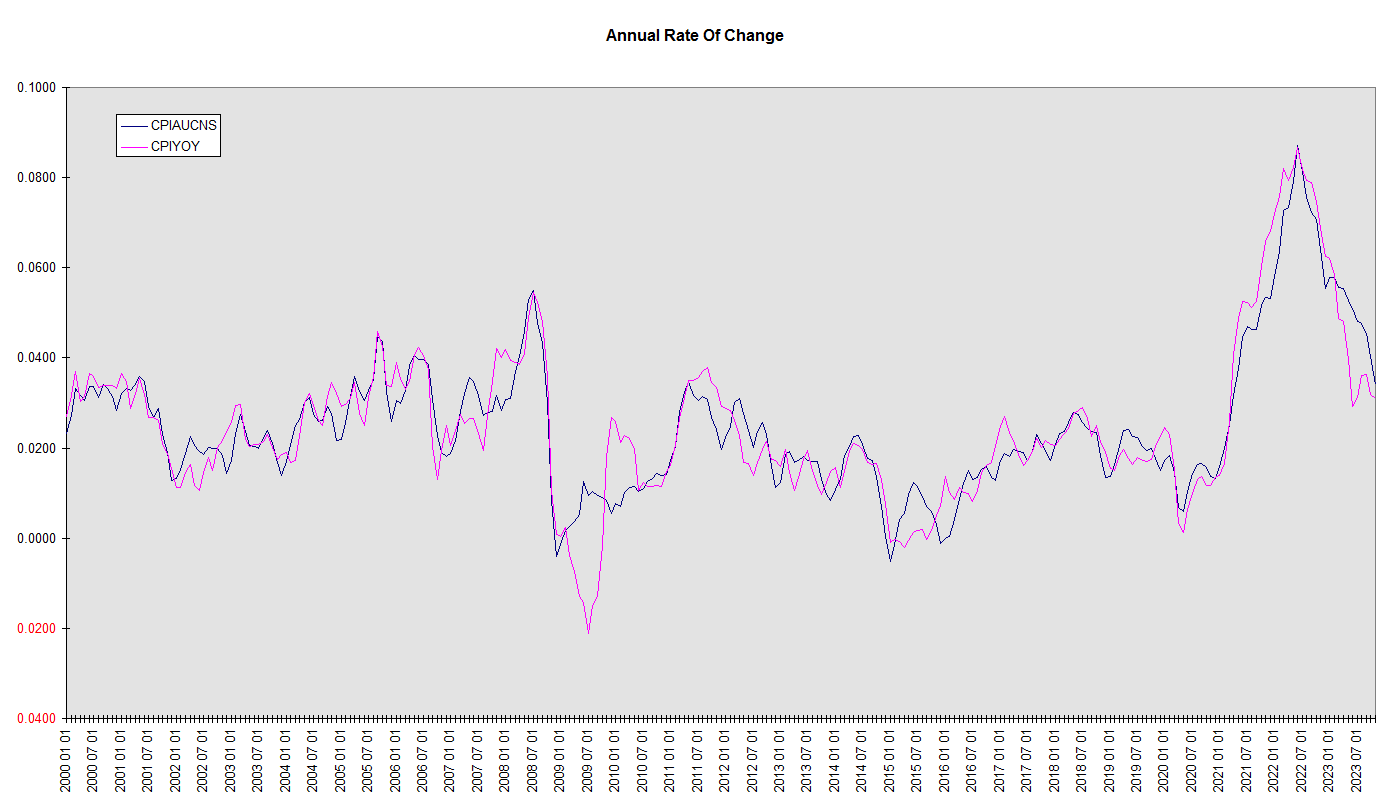
Incidentally, using this method, the latest annual CPI increase is not 3.14%, but 3.46%.
Finally, as promised, let’s look at the lagging nature of consumer prices themselves. The relationship between asset prices and consumer prices is not simple. Because assets are used to store purchasing power for later use, the lags extend from nearly nothing to many years. And they involve multiple asset classes, encompassing the entirety of the world’s currency, bond, and stock markets. Yet we can find the unmistakeable signature of this relationship even by plotting only world stock prices versus the CPI.
Unlike many economic arguments, this argument is not based on statistical relationships. It’s a conclusion from first principles. It is because it must be, because increases across the broad range of assets and across the broad range of consumer goods and services both stem from the same source, a decline in the value of the pricing unit. But we can see it at work in the following chart. This chart uses the same protocol we used in the last chart – each plot represents the annual rate of change calculated by comparing the current value with the average over the past two years. Due to its much greater volatility, the stocks plot is compressed by a factor of four.
We see stock price inflation rise, followed by consumer price inflation. We see it fall, followed by the CPI. This is especially evident in the larger and more persistent moves, such as those in the early 2000s, in the years of the financial crisis later that decade, and again in the time since 2020. The conclusion is unmistakable. If you want to see what inflation is doing, watch asset prices.
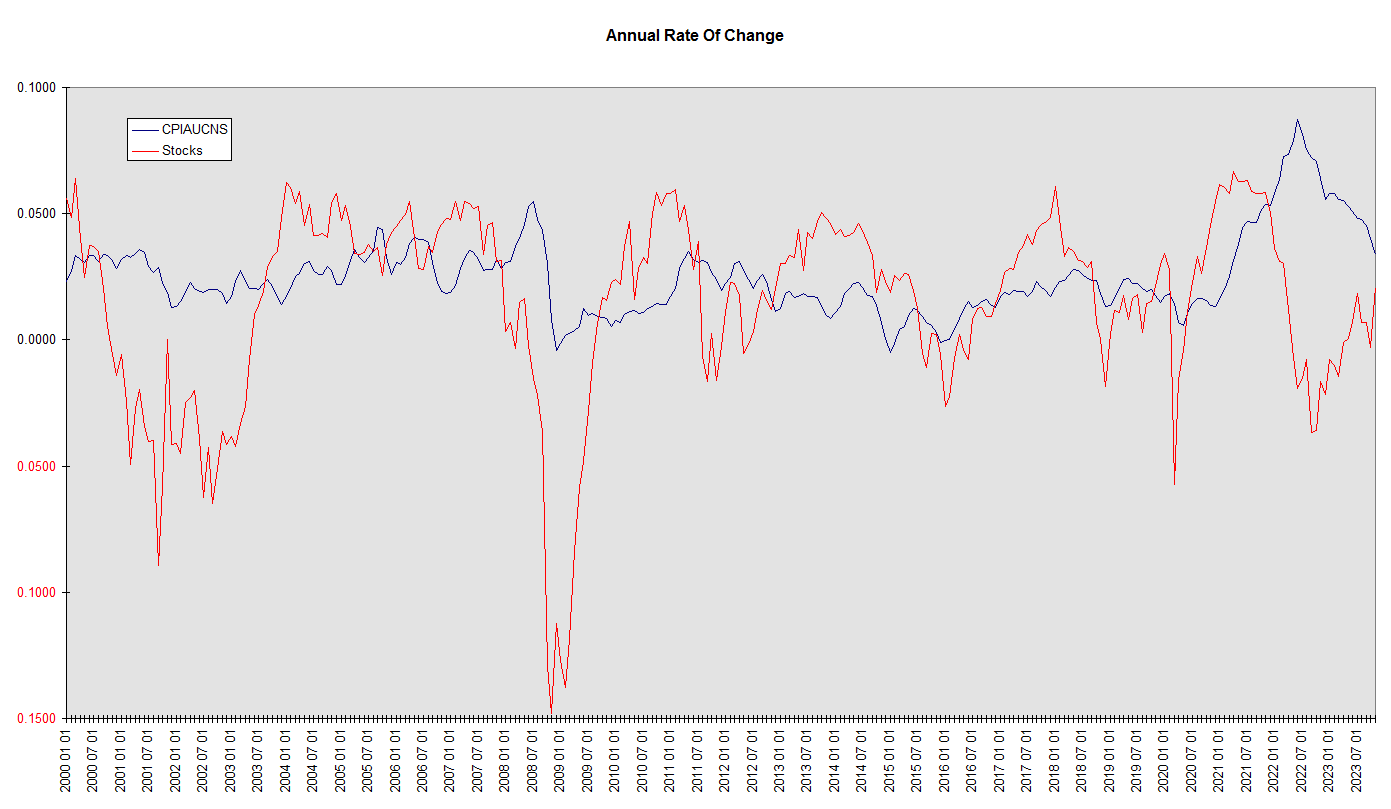
We can see the stock price deflation at the turn of the century followed by a spell of consumer price disinflation. Stock prices began to head south in late 2007, then outright consumer price deflation emerged in late 2008. Plain as day, we can see the stock price inflation surge out of the Covid lows, followed by a CPI inflation surge. Stock price inflation retreated in 2022, followed by a retreat in CPI inflation. Then in 2023 we see a stock price inflation resurgence, as markets anticipate less tight policy ahead. It will have to stop or the next shoe to drop will be resurgent CPI inflation.
Again, the phenomenon extends to all the world’s securities, so stock prices alone are only part of the picture. When we see dollar prices increase across the board (an “everything rally”), not only for stocks, but bonds, foreign currencies, and other assets, we can be sure the dollars are losing purchasing power, and that unless reversed, this loss is destined, with multiple and variable lags, to later arrive in consumer prices.
When it comes to inflation, markets are following the wrong data. They should be following themselves.
*Technically, a geometric mean. Financology takes the natural log of each monthly CPI data point, sums 1/2 the two year earlier data, the next 23, and 1/2 the current data, and divides by 24. Exponentiating the result gives the smoothed two year trailing CPI. Since the net time lag is exactly one year, dividing the current CPI by this figure yields an annual rate analogous to the year over year method, but without the susceptibility to local fluctuations in the year ago data.
This is not the only possible way to suppress base effect noise. One could for example apply a triangle filter or an infinite impulse response exponential to accomplish this. Depending on the choice, seasonality may merit separate treatment.
it’s a good thing health insurance prices are 30% lower than a year ago
https://www.youtube.com/watch?v=X2VTAKN1ZoI
You might like it (Shale)
Where do the lags come from?
First, the asset markets reprice instantly, in real time, in response to changes in the value of the currency as supply and demand fluctuate. Consumer prices don’t. The price of bread on your grocery store shelf is usually the same as it was yesterday. Your rent only adjusts once a year or whenever your lease is up for renewal. Wages, a major input to consumer prices, are often set by multiyear contract.
Furthermore, assets are used to store purchasing power for later use. Some, especially stocks and bonds, for many years. So assets themselves collectively serve as a sort of storage reservoir for the price effects of inflation. Notional changes in their purchasing power are reconciled with actual purchasing power, defined by the body of goods and services available for purchase, over the course of time.
Net-net, it is fair to say consumer prices don’t record inflation, but rather its exhaust fumes.
An unintended (?) or at least unappreciated consequence of this lag is that inflation looks like growth in its early stages. Since real GDP is arrived at by measuring nominal GDP and backing out inflation, the unacknowledged inflation makes real GDP growth appear higher than it is. Asset prices rise, but since consumer prices haven’t yet, it looks like real wealth increased. The initial inflation reduces real wages, making the real cost of labor cheaper, so any labor surplus (unemployment) is reduced. But all of these effects are transient, first derivative phenomena, not sustainable improvements in the economy.
In the longer run, they’re harmful to living standards because they create the illusion that easy money really does support growth and lead to a cycle of repeated economic “stimulus” that crowds out real economic progress. Inflation doesn’t stimulate growth, it becomes its surrogate and displaces it.
For political reasons, the Fed can’t come right out and say it’s targeting stock prices. But it can and should target broad asset price inflation. More particularly, the aggregate global market cap of the securities markets. This is the only way it will ever stop falling behind the curve.