The latest Synthetic Systems chart has been posted in Market Analysis. A copy is attached below for questions, comments or discussion.
The latest Synthetic Systems chart has been posted in Market Analysis. A copy is attached below for questions, comments or discussion.
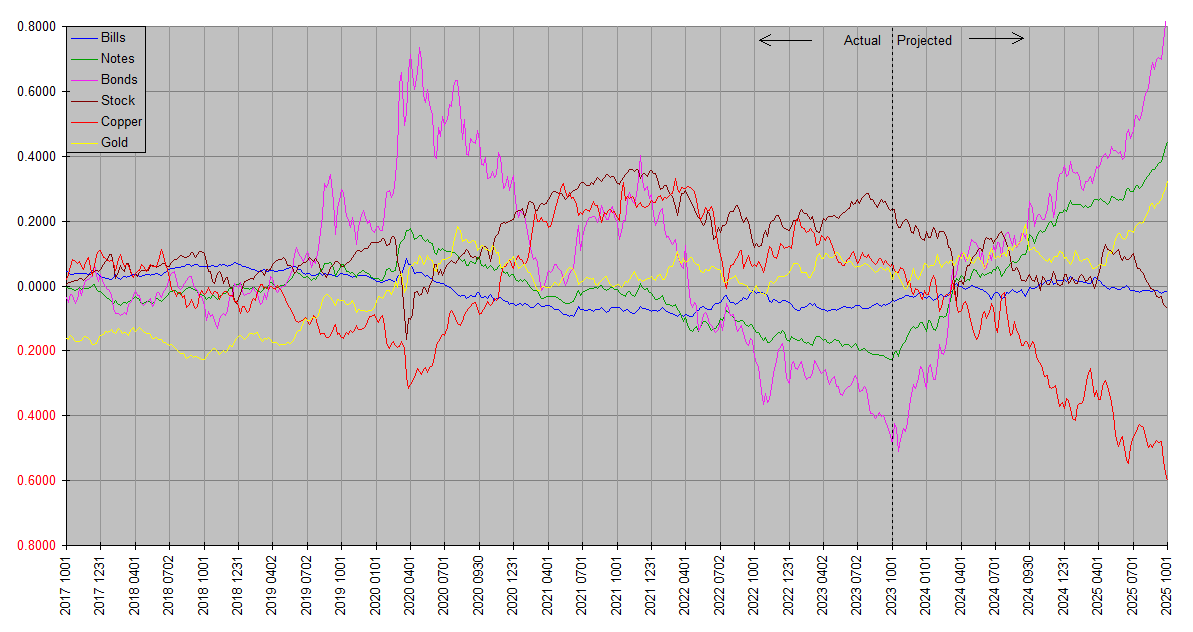
The projected Bond – is that the Bond Yield or price of a bond fund ?
Good question … thanks, rtchoke. I normally post a detailed explanation with each quarterly update but was a little rushed this time. For reference, the basics are summarized on the Market Analysis page. It’s the official home for Synthetic Systems forecasts; I post update notices here mostly just because that page has no provision for discussion.
In order to put each asset class on the same footing, the charts are all of total returns. So this includes the effects of both price fluctuations and yield. Of course in the case of copper and gold, the yield is zero so the total return reduces to price.
The total returns are not necessarily in terms of dollars though … that would overlook the fact that dollars themselves fluctuate in value. So this puts the focus on relative returns. One plot sloping upward more steeply than another, or sloping downward less steeply than another, indicates relative outperformance. Roughly speaking, the plots represent real total returns.
For much of the past decade and a half, TBill yields were near zero, so that plot effectively represented the dollar itself. With TBill yields in the five percent range, they outperform the dollar by that much, or looked at the other way around, the dollar is the TBill plot minus the TBill yield.
As for the Bonds plot in particular, as explained on the Market Analysis page, that represents a hypothetical infinite maturity bond. At current yields, that would correspond to a bond with a duration of over twenty years. Few real world instruments are in this ballpark … the closest I’m aware of are the highly volatile Vanguard fund EDV and the 20+ year zero coupon bonds it represents. The Notes plot is far more representative of the bulk of the bond market. Click here for a detailed explanation.
Also be mindful that SS has been projecting a rally in bonds for about a year … and we’re still waiting. So while it historically has been pretty accurate on bonds, I’m taking its forecast with an extra grain of salt until it rediscovers the plot. The Market Analysis page specifically shows past SS forecasts so you can evaluate how well it’s been tracking.
thank you!!
bonds rising that sharply would imply a credit crisis, financial crash, all out qe, something dramatic. yet equities are projected to be relatively numb for 4-5 months in the face of whatever the bond trigger might be. i find that pair of predictions hard to reconcile.
Me too, JK. I do think that bond bull is still out there, but doubt it will approach that magnitude. The top corresponded with yields at something like 800 or 4000 year lows, depending on which source you prefer, and we’re not going back there in our lifetimes. Although after the extremes of 2020-2021, an all out financial crisis wouldn’t be beyond belief. Another point to remember is that Notes represents the Treasury bond market at large … the Bills and Bonds plots the bookending extremes of zero and infinite maturity.
Stocks, on the other hand, I suspect have more downside than SS thinks. Recall SS is designed to be independent of my subjective analysis. It’s often more accurate but often less so too. It will eventually regain its bearings, though has been wrong on stocks and bonds for the last four quarters. It’s objective, but at least in this context, you can think of AI as standing for Ain’t Infallible.