The latest Synthetic Systems chart has been posted. This version includes an update to the model, discussed previously in Synthetic Systems Beta. A new Treasury plot, Notes, has been added. The name understates its scope; it is the entire US Treasury market from zero to thirty years maturity; the name distinguishes it from the Bills and Bonds plots that bookend it, but also reflects that it’s a reasonable approximation for the notes range of Treasury issues. Its comprehensive scope makes it the flagship of the Treasury plots.
Overview
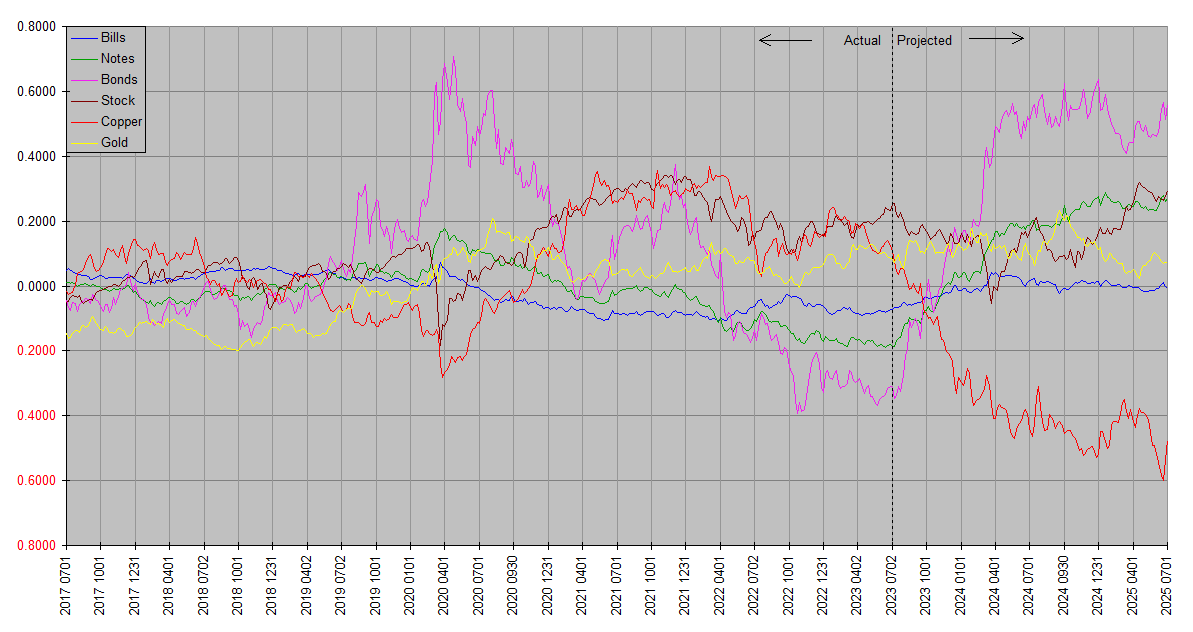
Synthetic Systems is a computer forecasting model covering six asset classes: Treasury bills, notes & bonds; stocks, copper & gold. The plots are all on the same basis so as to be directly comparable – total return. So the slope of one asset rising more than another indicates outperformance, and vice versa. Plots are in natural log space so that the same vertical increment means the same proportional (percentage) increase regardless of vertical position. The total returns are not denominated in dollars or any other currency, but are relative to each other.
Bills refers to US Treasury securities of effectively zero maturity and duration, similar to a Treasury money market or ultrashort bond fund. Notes represents the entire Treasury market. Bonds refers to US Treasury securities of effectively infinite maturity (duration reciprocal of yield), but approximates the returns of real world extended duration Treasury funds like EDV, and to lesser extent VGLT and TLT. A broad UST fund like GOVT is around midway between Bills and Bonds, approximated by Notes. Stocks refers to the entire asset class (not just US or any one country). Copper and Gold represent the respective elementary commodities, except to note that copper is broadly indicative of physical commodities as a class and suggestive of trends in goods and services price inflation.
The charts are best considered together. Annual and quarterly charts are respectively grouped together on dedicated pages under Market Analysis to facilitate this. The forecasting accuracy of Synthetic Systems is best evaluated by comparing successive charts, as the “Projected” time frame of an earlier chart slides to the left into the “Actual” time frame of later charts. Moreover, similarities between the latest update and earlier updates indicate areas of greater confidence in contrast to differences which indicate greater uncertainty.
Synthetic Systems forecasts comprehensively reflect financial and economic forces (e.g inflation, interest rates, monetary policy, money flows, seasonality, natural resources, technology, demographics, the business cycle, global economic trends, consumer sentiment, investor psychology, momentum, mean reversion, etcetera), but do not reflect external noneconomic factors (e.g. natural disasters, pandemics, unexpected geopolitical disruptions) until they are incorporated into the financial and economic sphere. It’s most applicable over time frames from one quarter year to four years … its accuracy is limited by noise and news flow on the shorter time frames and it also does not attempt to model drivers of longer term returns such as valuations.
Readers are encouraged to consider Synthetic Systems forecasts in conjunction with fundamentals and valuations. Synthetic Systems however often forecasts trends long before the fundamentals fall into place; for this reason it’s useful as a medium term planning guide, with the appearance of fundamentals consistent with a Synthetic Systems forecast serving as confirmation, the lack thereof nonconfirmation. Final confirmation occurs when the trend is actually in evidence.
Annual updates are designated by the year with no decimals (eg 2023); quarterly updates with decimals (eg 2023.00).
Discussion
The current forecasts should be taken with an extra grain of salt, especially with respect to the shorter term outlook. SS has missed on the shorter term for a couple of quarters, which generally persists until a more successful forecast is confirmed. It’s particularly missed on Stocks, and more atypically on Bonds, where it’s usually the most accurate. We’ll continue to be extra skeptical of SS forecasts until it has shown at least one improved quarter indicating it has resynchronized with the markets.
I can only speculate as to why SS has lost the plot. Periods of badly missed forecasts have turned up in testing, and there’s no obvious common factor. One here could be the long delay by the Federal Reserve in tightening policy in response to inflation; despite its aggressive attempt to catch up, monetary policy is still not tight. Another factor could be the unusually large fiscal deficits. Neither of these excuse this stretch of poor performance though … SS ‘should’ have taken notice of such divergences sooner. It will, but we’ll only know when when it produces a more successful forecast.
For what it’s worth, it’s had plenty of distinguished company, with Wall Street’s finest having forecasted similar outcomes. Ultimately that could be the main reason … had too much company. Too much money positioned for an outcome makes it harder to attain … it’s not possible for everyone to outperform the market.
You mention stretches of missed forecasts turning up in testing. How long do they typically last?
And what is this? Some kind of AI?
Generally a few quarters, maybe two to six. They definitely cluster though, as if something new happens and SS has to learn about it. Or they’re transient deviations from an underlying market process and the market eventually returns to script. The latter happens at least some of the time … often SS sees something three or four years out, and it happens, but it either hits or misses in between. One example was the 2021 inflation surge. 2021 surging commodity prices showed up in annual forecasts as early as 2017. But SS completely missed the covid-inspired deflationary crash in the first quarter of 2020.
You could call it a specialized form of AI. It’s generative in its forecasts but the only language it speaks is math. The intelligent aspect is it’s designed to learn from its mistakes. I wish I could disclose how it works, but if were ever widely adopted (say by hedge funds) it would lose its edge. We’ve just seen what happens when its forecasts are widely shared.