Background
As promised in Breadth Buckles Again it’s time to update our model income portfolio. First some preliminaries. The retirement investing approach most commonly advocated by financial planners is based on the assumption of spending down capital through retirement so that neither is a lot left over nor does it run out. It is well suited to the standard type of retirement accounts such as traditional IRAs and 401(k)s, since the IRS requires these accounts to be drawn down anyway.
Outside of such required schedules the financial planning industry has advocated alternatives like the “4% rule”, which boils down to spending 4% of your portfolio value in the first year of retirement, and adjusting the amount by the CPI annually thereafter. This model is rife with problems. First, once the withdrawal pace is set, there is no feedback mechanism to adjust it for a changing world over the course of decades. For all the planning, a lot of ad hoc adjustment is going to be needed anyway. The 4% figure itself has come under scrutiny, with many now advocating a 3% rate or even lower, to reduce the possibility of running out of money. Second, you don’t know how long you’re going to live or how the markets will perform. Withdrawal rates are based on statistical life expectancies, historical markets performance and Monte Carlo simulations. While statistics can represent the average retiree, very few retirees actually expire right on schedule, so it’s almost assured to be wrong for you as an individual. And I don’t know about you, but playing Monte Carlo with my life savings isn’t very appealing. Third, it makes no provision for leaving a legacy for heirs. Finally, there is “sequence of returns” risk … the added stress of worrying about wild fluctuations in what your investments could be sold for … because you’re depending on selling them.
In short, it attempts to make your investment portfolio act like an annuity … income that lasts as long as you live then is gone. Yet you probably already have an annuity … Social Security is one example. Some may have a pension, and even those who don’t have the option of converting some of their accumulated assets into one sold by an insurance company. So trying to shoehorn your entire life savings into a messy annuity-like model not only can’t safely and accurately be done, but it reduces your diversification among strategies. It’s like having a dog and a cat and trying to convert your cat into a dog. Why? You already have one.
I prefer to let annuities be annuities and portfolio assets be portfolio assets. Most of us are best off with some of both.
Some portfolio assets are best suited for generating income without having to be depleted. And by this I mean investments in an ordinary brokerage account or Roth IRA. Recall the IRS will require you to draw down your traditional IRA, so the following does not apply there. What follows is best for regular taxable accounts and Roth accounts.
You can structure a portfolio that yields in excess of the more recently recommended “safe” withdrawal rates and which yield should grow in excess of inflation over time as well. For this portion of your retirement, there is also no risk of outliving your money because you won’t be selling off your shares. For the same reason, you’re also freed from worry about what will happen to market prices and the risk of having to sell low.
The Portfolio
This model portfolio is designed for that purpose. It comprises a dozen exchange traded funds. It is broadly diversified among US treasuries and global stocks.
GOVT 480
VT 120
DTD 120
DNL 80
QDF 10
IQDF 190
VFQY 6
VFVA 18
VYMI 54
VSS 6
REET 36
COMT 36
The above are share counts for a roughly $50,000 allocation. Double them for a $100,000 allocation, dectuple for $500,000, etcetera as appropriate. As listed it’s roughly 25% treasuries and 75% equities. Vary the amounts of the first two on the list – GOVT & VT – so that the overall mix meets your allocation targets. For those who prefer percentage allocations, here are those at today’s midyear closing prices of all except for the variable GOVT and VT:
DTD 31.81%
DNL 12.23%
QDF 2.47%
IQDF 17.98%
VFQY 2.92%
VFVA 7.66%
VYMI 14.57%
VSS 2.83%
REET 3.53%
COMT 3.99%
This adds up to slightly under half US, a bit over half XS, an underweight to US given that the US is about 60% of world market cap.
Let’s talk about these funds and why this particular combination.
GOVT is the iShares US Treasury Bond ETF. It covers the entire nominal US Treasury market from one to thirty years maturity.
VT is the Vanguard Total World Stock ETF. It covers the entire world stock market, with nearly ten thousand stocks.
For a simple, modest, portfolio, US investors could stop there. But we can improve the stock allocation it by tilting the field towards dividends, quality and value. Another way to say it is starting with the world stock market and underweighting the shares of supersized companies that don’t pay dividends, and throwing out the junk that is overpriced or poor quality. What remains is still exceptionally broadly diversified.
DTD is the WisdomTree US Total Dividend Fund. It receives the lion’s share of the US stock allocation. It essentially covers the entire US stock market, except that rather than being weighed by market cap, it’s weighted by dividend stream. It aims to own each stock in proportion to the aggregate dollar amount of dividends expected to be paid over the following year. It does not include stocks that don’t pay dividends, such as Alphabet, Amazon, Meta Platforms, and other supersized nondividend payers. It does include Apple, Microsoft, and even Nvidia, although at much reduced weights as compared to market cap based indices. This reduces dependency on potentially overextended areas of the market.
It would be nice if WisdomTree offered an XS (ex-US) counterpart to DTD. But it doesn’t. The closest it comes is DNL, the WisdomTree Global ex‐US Quality Dividend Growth Fund. It is also a dividend weighted index, but is screened for growth. Its largest holding for example is the company that actually makes Nvidia’s chips, Taiwan Semiconductor.
QDF is the FlexShares US Quality Dividend Fund. It focuses on quality US stocks that pay dividends.
IQDF is the FlexShares International Quality Dividend Fund. It is the XS counterpart of QDF. It balances the growth oriented DNL with a value orientation … the combination more closely resembling what that missing DTD counterpart might look like.
The intent is not to entirely exclude nondividend paying stocks. Today’s small cap companies can become tomorrow’s big dividend payers, and can even further broaden and balance stock market exposure. VFQY is the Vanguard US Quality Factor ETF. VFVA is the Vanguard US Value Factor ETF. These are actively managed funds that include several hundred stocks each, but feature Vanguard’s trademark low expenses. VFVA in particular sports a dividend yield competitive with DTD, with a higher historical growth rate. VFQY complements it by including a higher allocation to growthier sectors like tech, balancing out sector exposure. Impressively enough, though, VFVA has actually grown dividends faster, inspiring its higher weighting in the mix. These are both all-cap funds but notably tilted towards small caps. And both have both a higher yield and a higher dividend growth rate than the US stock market as a whole.
VYMI, the Vanguard International High Dividend Yield ETF, replaces VXUS in earlier versions of the Model Portfolio. This is another example of strikingly value added selection. Typically one faces a tradeoff in dividend investing. You can have a high yield or you can have a growing yield. This fund starts with the same stock universe as VXUS – the entire world ex-US – but has demonstrated both a higher yield and a higher dividend growth rate since its inception. It is also very broadly based, including well over a thousand stocks with the top ten accounting for less than 15% of its value. It has also significantly outperformed its universe on a total return basis.
This leaves just XS small caps. All three of the above ex-US funds underweight or exclude them. VSS, the Vanguard FTSE All-World ex-US Small-Cap ETF, fills this gap.
So our list now covers the entire global stock market with special emphasis on dividends, quality and value.
Let’s dig deeper still. Being an otherwise outstanding fund, VYMI inexplicably excludes REITs. This is a structural defect; according to Vanguard’s web site: “Excludes REITs, which generally do not benefit from currently favorable tax rates on qualified dividends.” We want our portfolio to be broadly balanced by geography, sector and market cap, so we don’t want such structural omissions in coverage having nothing to do with a fund’s investment objective. (We don’t buy Vanguard’s excuse since many of its other funds, as well as those of its competitors, include REITs). So we have a hole to patch up. Oddly, Vanguard no longer offers a REIT fund capable of filling the gap. Its ex-US real estate fund, VNQI, is not a REIT fund, including not only REITs but non-REIT real estate companies as well. So using VNQI would introduce an overlap duplicating coverage of non-REIT real estate stocks.
It also turns out that, even though the fund materials don’t say they exclude REITs, our two Vanguard US funds, VFQY & VFVA, apparently do exclude them, based on a review of their holdings lists and realty sector underweights. And Vanguard’s US counterpart to VNQI, VNQ, was a few years ago expanded to also include non-REIT real estate, leading to the same messy overlap and duplication problem if you tried to use it to plug the hole. As a result these three Vanguard funds are all underweighted in real estate due to structurally excluding REITs, and Vanguard’s fund lineup offers no clean patch.
This is where REET, the iShares Global REIT ETF, comes in. Our position in VYMI however is larger than in VFQY-VFVA, so that only would leave us either underweight ex-US realty or overweight US realty. VSS to the rescue once again … it is solidly overweight realty relative to the overall XS market, due to REITs being primarily smaller cap stocks, balancing out the deficit. The share proportions listed above take this carefully into account; in fact, given that this is an income-oriented portfolio and REITs are important income-producing investments, we’ve added a bit more just for good measure. If you are already heavy in real estate elsewhere, feel free to reduce it a bit.
That leaves COMT, the iShares GSCI Commodity Dynamic Roll Strategy ETF. Commodities are a vital part of any investment portfolio. COMT fills this niche. Tweak exposure to circumstance and taste.
More about the fund selections
Besides broad, balanced and inclusive coverage, a key part of these fund selections is based both on current yield and potential growth of that yield. It’s often the case that investors face a tradeoff between them. Most dividend funds are marketed either as high dividend or dividend growth funds. That is, you can either have a generous current income or a growing income, but not both. Dividend growth funds furthermore tend to look for that growth in the past; for some for example the main stock selection criterion is ten or twenty five years of increasing payouts in. Thanks, but we can’t collect past dividends. The best dividend growers of the future are not necessarily those of the past. The result is that for their lower current yields, dividend growth funds haven’t necessarily produced more dividend growth. As we’ve seen, several of our fund selections offer both more attractive current yields and, at the fund level where we care about it, more attractive dividend growth than the competition.
We of course don’t know how the financial markets will perform in the future, but we can compare the historical performance of funds with each other, looking for relationships that are likely to hold. If fund X and fund Y for example both fish in the same lake, but fund X has consistently reeled in a better combination of cash flow and cash flow growth, we suspect that will continue to be the case, especially in these types of funds where the selection and weighting criteria are primarily algorithmic. This is a more substantial use of historical data than simple past returns, which can reflect recently inflated prices. So instead we’ve used the dividend history to project future dividends.
One use of this data is to sum the expected dividends over the next four years and divide by the current price to find an expected forward yield. VYMI for instance is projected to pay an average of $3.66 per share from 2024 to 2028. At a recent price of $62.56, this amounts to a 5.85% yield. Compare that to VXUS, which is expected to pay $1.70, which at a recent price translates to a 3.08% yield. This reflects both a current year expected VYMI yield of 4.78% and a payout growth rate of 7.97%, compared to a VXUS current year yield of 2.99% and a growth rate of 1.18%. Even when broadened and balanced with the missing small caps and REITs the VYMI composite forward yield comes out to 5.26%. Hence our earlier value added observation. Again, while this doesn’t tell us what those dividends will actually be, it does give us some insight into how funds operating in the same investment pool are likely to perform relative to each other. The following charts of the dividend history for two of the funds, with two others representing their investment pools, help illustrate:

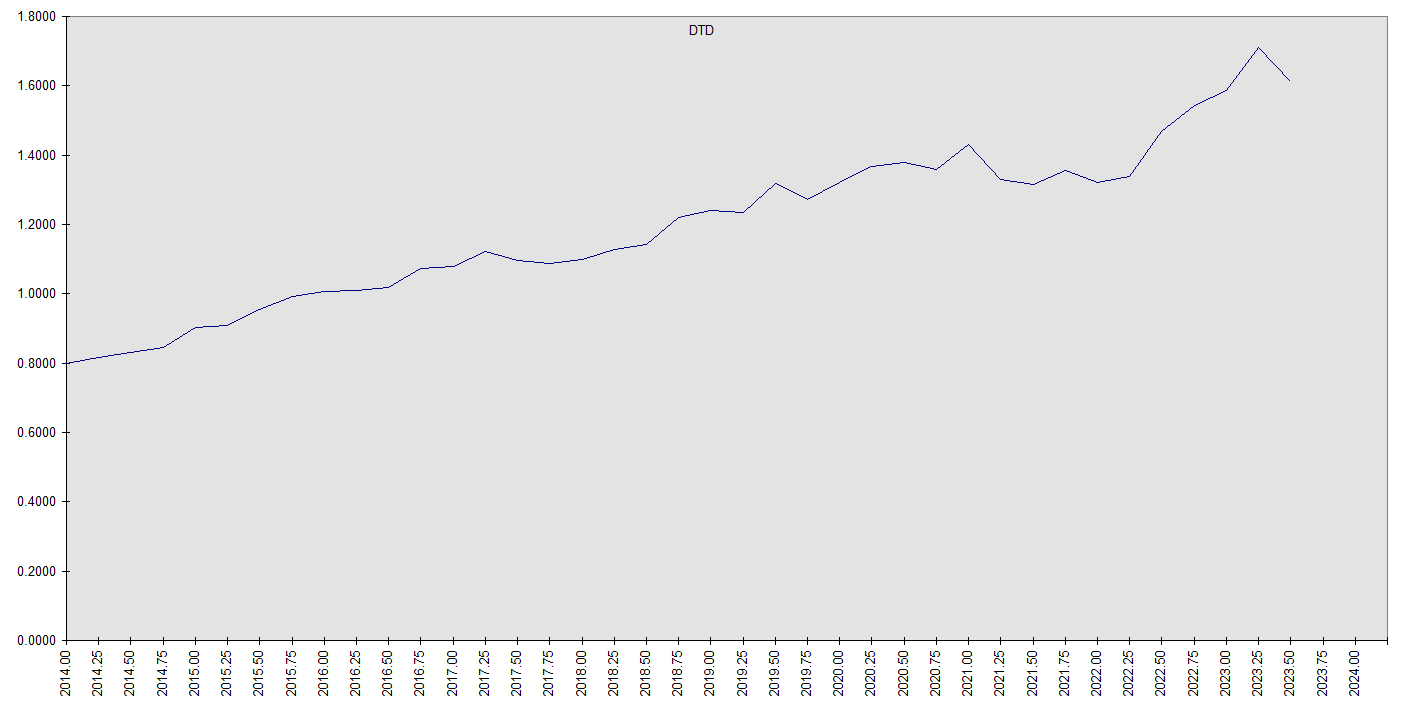
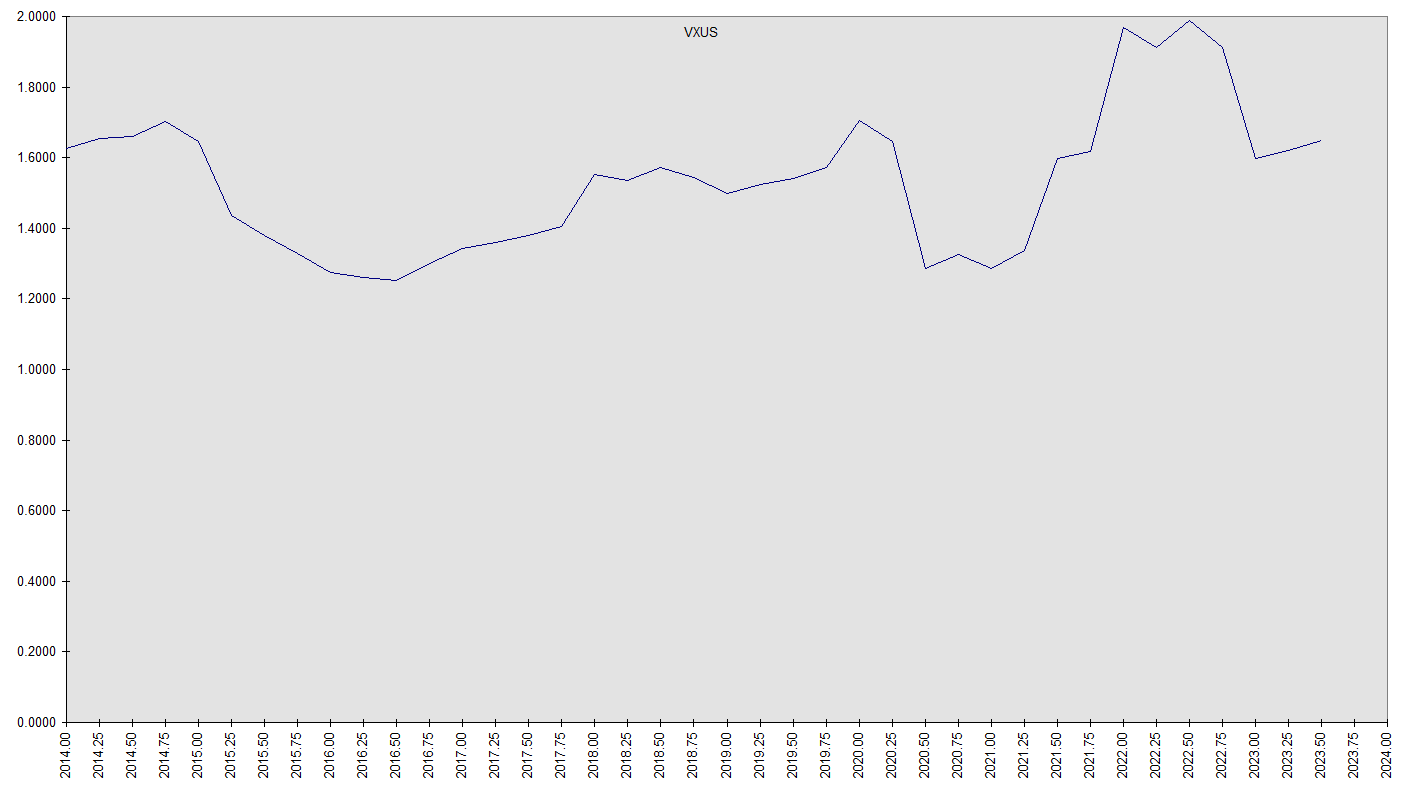
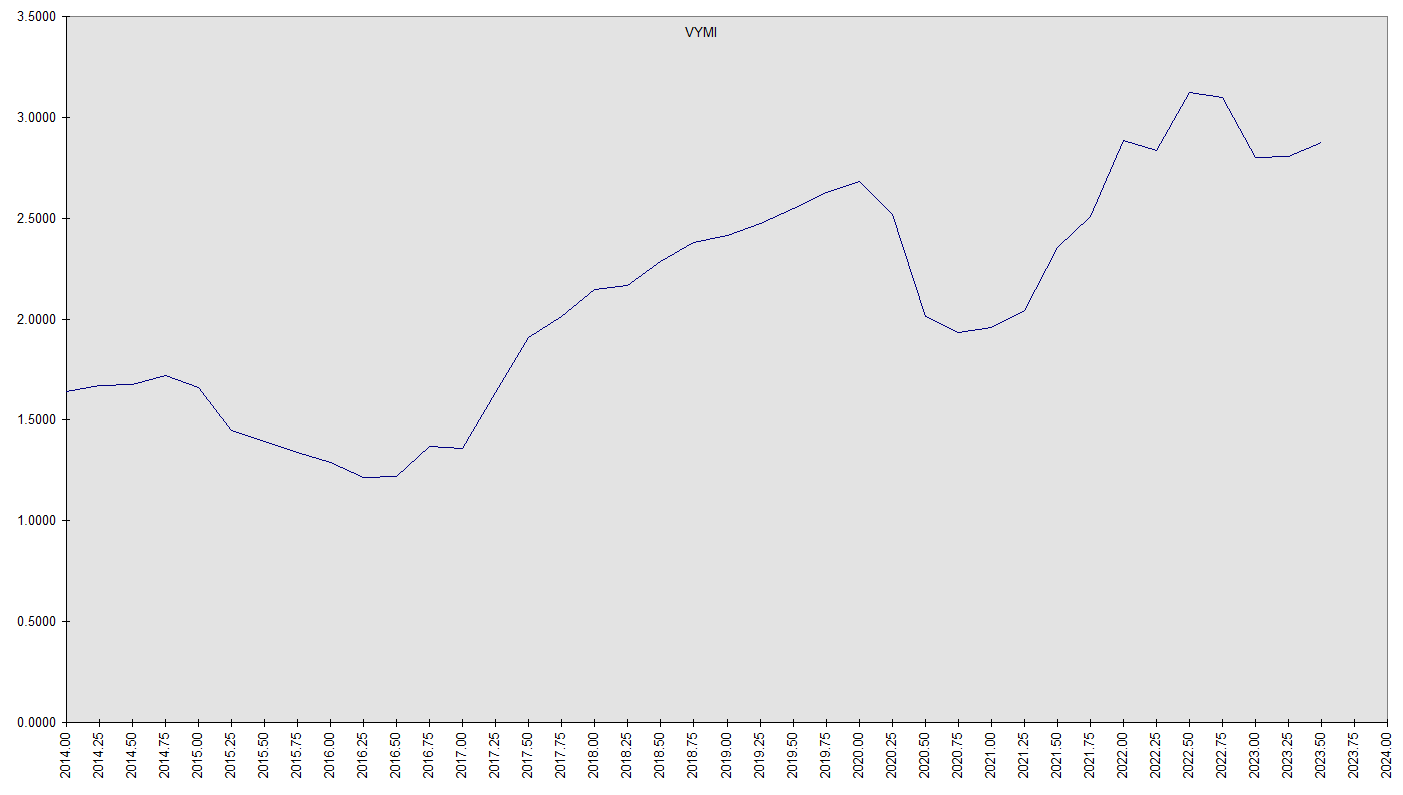
Notice the distribution growth rate of DTD actually exceeds that of its US stock lake represented by VTI and the growth rate in VYMI even more strikingly exceeds that of its XS counterpart lake in VXUS. That these funds do this while also sporting substantially higher current yields is impressive. Notice also how the dividend payments surged with the recent inflation.
Among the stock funds, little or no rebalancing should be necessary. Over time the best performers will grow to be a larger proportion, increasing their weighting, automatically improving the mix.
Conclusion
This is not only not an ideal portfolio for everyone; it’s not even a complete solution for anyone. Most also need a stash of savings for liquidity … to cover occasional expenses like a new car, vacation, medical care or unexpected emergencies. This would include cash and precious metals as well as stocks and bonds. Those might be more appropriate for your traditional IRA, your safe deposit box, or buried in your back yard. The income portfolio is however aimed at providing a long term growing stream of income based on a broad foundation of assets, including US treasuries and global stocks diversified and balanced by geography, sector and market cap. Think of it as an ETF made up of other ETFs … ideally we would like a stock fund that owns all the world’s stocks but weighted by dividends, quality and value rather than market cap. There not being such a thing, we’ve pieced one together from off-the-shelf parts. Once set up, it should require very little ongoing attention. Just collect the income. It’s meant as a complement to an annuity income and traditional IRA drawdown portfolio.
Finally, some general comments on constructing a fund portfolio. Too often the temptation is for investors, especially novices, to scan lists of top performing funds for ideas, and then compare them based on their historical returns. Every prospectus or fund document that lists such returns includes a requisite disclaimer to the effect of “past performance does not indicate future returns”. This may be boilerplate, but there are no truer words in finance. For any prospective investment, it is far better to understand what the fund holds and how it selects it. The most important information a fund issuer presents is in what asset class it invests, what geography, what sectors, what style, what market caps. What are the expenses. What are its holdings. And most of all, how do they relate to your investment objectives. The all important issue is how it fits together with other investments … a strong portfolio is not just a collection of isolated strong assets, it’s a gestalt thing.
a really good post, bill. thank you.
re ira/401k rmd’s- i think at some point the gov’t will require a proportion of all pension assets to be invested in some form of treasuries with inadequate yields. [“for our own good,” of course.] this, along with capital controls, will be part of a program of financial repression. therefore, one might consider taking larger distributions, balanced against the problem of being kicked into higher tax brackets.
Thanks JK. We can already see the outlines of it in the 401k area. The plan sponsor controls the menu of investments. The options are overwhelmingly stocks and bonds … commodities and gold options are rare.
Ideally there would be no such thing as a 401k. It’s not the 1960s anymore. Relatively few people spend an entire career with the same employer. This is one reason defined benefit pensions are disappearing. The IRA is the far better retirement account model. It offers a much wider range of investment options and is portable.
This may sound a little tin-foil-hattish, but I suspect the 401k model owes its heavy use not on its benefits to the employee, but to the corporatocracy. It queues up millions of captive buyers for corporate securities. Little need to serve shareholder interests when you’ve got a systemic line on trillions of cheap capital. Just keep the insider stock option and share buyback gravy train rolling.
Do you really think the main motive behind extending the age limits for required withdrawals was concern for the account holder? Or did Wall Street find a way to reduce stock sales and keep more of its cheap capital? That Congress might find ways tap into this same stream of funding wouldn’t be a stretch to imagine.
Why so much more liberal contribution limits for 401ks than IRAs? Why so much emphasis on the “employer match” gimmick available only in 401(k)s? Nothing prevents the same compensation being included in ordinary salary and bonuses. Except if it were, people could get the same benefit by receiving it directly and depositing it in their IRAs. Add to that the new automatic enrollment feature … with that the employee has to make an active decision not to contribute. Selling stocks and bonds has never been easier or more lucrative.
This incidentally ties into my disdain for the stocks of massive mature corporations that pay no dividends. Buying them isn’t receiving a return from their business, it’s subsidizing it. Smaller companies justifiably expect it, because they hold the potential to become big companies that do pay shareholders for the use of their capital. But once they’ve become big, that free shareholder capital winds up being squandered on insider wealth and other forms of malinvestment.
mike green has written and talked a lot about the cancer that is passive, cap-weighted indexing, and the target date funds which are default options in 401k’s. these pour ever more money into the highest cap stocks, creating a momentum effect that must be chased by active managers.
apple and microsoft, just those 2 stocks, now constitute 15% of the s&p.
there will be a lot of unhappy campers when the seems-to-me inevitable collapse of the superbubble [pace grantham] occurs.
What a country. Automatic free capital for oligarchs. This fund portfolio avoids it as far as possible while still covering the whole market. The exception is VT, which levels things out a bit by going global, and even that can be dialed down or omitted … some of my accounts use only the remainder.
Quick recap of the arguments for and against cap weighted indexing.
Pros: Investors in the aggregate are by necessity cap weighted. A cap weighted fund needs nearly no trading or rebalancing because as the value of a position changes, its weighting changes with it. That reduces turnover and expenses to nearly nil, as suggested by VT’s 0.07% expense ratio … incredibly low for a fund with nearly ten thousand holdings. The global market portfolio – really a cap-weighted cross-asset portfolio of the whole world’s investments – is in a sense the lowest risk portfolio possible … its investor always has the same share of global wealth no matter what happens to the prices of its constituents. You can never lose your share of the world’s wealth.
Cons: If everybody does it, capitalism is dead. The capital markets aren’t there just to provide investors with returns … functioning properly, investors’ profit-seeking behavior in the aggregate directs capital to those projects that satisfy the most human desires at the least cost in resources. The difference is the source of profits. This is what has produced modern civilized living standards. We talked about that in more depth in The Economics of Equity & The Economics of Equity – The Sequel. If everyone indexed, who would be allocating capital? All projects would get the same proportion of funding regardless of merit. Living standards would waste away and civilization with them.
How to reconcile these competing issues? Not everyone needs to be an actively involved capital allocator, no more than everyone needs to be a plumber or politician. Not everyone knows how. Those who don’t can ride the coattails of those who do. They are the indexers. Yet their success, and that of the entire global economy and the living standards of everyone in it, depends on intelligent and thoughtful non-cap-indexed capital allocators.
Other factors besides cap indexing have contributed to the evils of runaway valuations for a small group of big companies. Years of ultralow rate policy have reduced the importance of yield in investors eyes, putting unnatural focus on capital appreciation. The lifting of most restrictions on share buybacks and the widespread adoption of stock option compensation has contributed heavily as well.
FWIW, this model portfolio brings this reconciliation under one roof. Even ex-VT, the fund lineup seeks risk reduction by following the broad outlines of the global market portfolio, but within the parts to add value through its departures from cap weighting and emphasis on merit.
James Montier of GMO just published an excellent paper on the merits of a quality and value focus especially in relation to performance in equity market drawdowns:
https://www.advisorperspectives.com/commentaries/2023/07/12/factor-bond-credit-inflation-gmo
You’ll want to read the paper, but in broad terms he sees using a combination of cash along with a focus on quality and value in equity portfolios as mitigating some of the drawdown risk. I would add to that some exposure to Treasuries and gold.
Potential substitutions: QDF & IQDF can potentially be substituted with SCHD & SCHY 1:1 while maintaining the balance of the combination.
SCHD is Schwab’s US dividend fund and SCHY its XS counterpart. SCHD has a superior track record in both current yield and dividend growth. SCHY doesn’t have enough history to properly evaluate though, and has a weird structural cap on promising emerging markets. In addition it pays dividends only semiannually. So the jury is still out.
None are perfect … the Schwab funds also have an arbitrary 100 stock limit on the indexes they track, while the FlexShares funds IMHO overemphasize broad market beta tracking. We prefer the wider footprint of the FlexShares funds but the lower expenses of the Schwab funds. We’ll monitor these funds going forward, but it will take at least a couple more years to finalize. For now, the preliminary data is strong enough to warrant substituting part of QDF & IQDF with SCHD & SCHY.
GOVT 480
VT 120
DTD 120
DNL 80
QDF 2
IQDF 166
SCHD 8
SCHY 24
VFQY 6
VFVA 18
VYMI 54
VSS 6
REET 36
COMT 36
Okay let’s put the pieces together. The position in QDF is not large enough to justify keeping. Let’s replace it with VYMI’s US counterpart VYM. I had passed on it previously due to it, like VYMI, excluding REITs. I’d like these funds better without this exclusion, but our position in REET is more than enough to compensate.
The Schwab funds have some strong positives but offsetting negatives make them better as auxiliaries to our core lineup. The US version (SCHD) has performed very well and has grown very large yet is still limited to a 100 stock index. This can come to pressure performance at some point. Besides the small number of stocks, the XS version (SCHY) limits “emerging markets” to no more than 15%. This is perplexing given that these are the world’s most dynamic economies, cover most of its population, and produce a much larger share of economic output than their market caps would suggest. As I’ve written before, the distinction between “developed” and “emerging” is subjective and arbitrary. The main relevant respect in which the “emerging” are not “developed” is that much less of their enterprise has been securitized and listed on exchanges. This if anything to me suggests more, not less, potential. The XS version also adds volatility screening. It appears that the source of the strong track record of its US counterpart is in the quality rankings based on financial ratios, which are diluted by these extraneous constraints in the XS version. They also both exclude REITs so introduce an arbitrary structural sector bias (REITs have been in the S&P 500 since 2001). The lack of quarterly dividend payments for the XS version makes it inconvenient for income investors too, but it’s possible that as the fund grows quarterly dividends will be instituted. Hopefully the EM cap and volatility screen will be scrapped too. For now they warrant a supporting role as convenient swing positions to adjust relative US:XS weighting without disturbing the balance between the core funds.
So this is what we now have:
GOVT 600
VT 120
DTD 80
DNL 80
IQDF 120
VYM 24
VFQY 6
VFVA 18
VYMI 72
VSS 8
REET 36
COMT 36
This is our custom composite income ETF. It contains two essentially complete equity income portfolios; DTD, DNL & IQDF and VYM, VFQY, VFVA, VYMI & VSS. REET and COMT compensate for the omission of REITs in some of the funds and round out commodities exposure. GOVT and VT are adjusted to reach any desired bond and stock allocation.
The above is summarized as Income V on the Model Portfolios page.