Inflation is Chronic
At the beginning of this decade, Financology flagged it for a likely return of inflation and a bull market in commodities.
But this wasn’t truly calling for anything new. Inflation had run rampant for years, just mostly apparent in asset prices. Our insight was only that it couldn’t stay there indefinitely.
Assets are used by investors to store value for future use. As such, inflation can build up there, creating the illusion of growing wealth. But as asset holders invariably begin to try and spend their accumulated wealth, the price effects of inflation begin to spill over into consumer prices. At which point it is finally recognized for what it has been all along. The 2020-2021 money printing orgy wasn’t so much cause as catalyst of this spillover.
The 2010s filled up the asset tank; 2020 overflowed it.
The upshot for investors is that effective hedging for inflation begins long before it’s making headlines. And that it’s about much more than just gold, commodities, and other strategies traditionally regarded as inflation hedges. Since we have inflation most of the time, the real question isn’t whether to hedge, but what hedges are most effective during which phases of the inflation cycle. Counterintuitively, once inflation is making headlines, it’s often been prudent to begin planning for deflation, as policymakers finally begin to address the belatedly recognized bogeyman. Every cycle is different, but a particularly memorable example was in 2008, when a historic deflationary crash emerged straight from the midst of an inflationary panic associated with $147 oil in the middle of that year.
I mention this to underscore that what follows is decidedly not thoughts about what investors should be doing now. My hope is that it might help readers prepare their to do lists for when the time is ripe. The advent of a wide selection of exchange traded funds makes ETFs a good fit for brokerage accounts.
Protecting Capital
Gold is one of the assets more traditionally associated with hedging inflation. And rightly so … over very long periods it has held its purchasing power while every man made form of money has failed. But it can’t do the job alone; it works best at certain phases of the inflation cycle while other assets do better in others. In the early months of the 2020 inflationary explosion, for example, gold did its job spectacularly. But as the worst of short term economic fears passed, the baton passed to stocks. Too many investors rushed to buy gold when CPI increases were making headlines in 2022, later complaining that it made a lousy inflation hedge. But loading up on gold when inflation is making headlines is the investment equivalent of trying to buy home insurance when your house is on fire. By then it’s time to start thinking about the next cycle.
Treasury Inflation Protected Securities (TIPS) are another widely recommended inflation hedge. I’m not a fan, however, for reasons detailed in I Don’t Like TIPS. Among other things, they are more correlated with stocks than nominal Treasuries are, so as a substitute for the plain vanilla variety forgo much of their diversification value. May as well just have more stocks and less Treasuries. Not to mention the prospect that as just observed, inflation can rapidly morph into deflation, where plain vanilla bonds shine. Finally, most of us already have the equivalent of a big slug of TIPS … CPI-indexed Social Security.
Other commodities besides gold are also excellent inflation hedges, just not necessarily at the same time as gold. Especially when economic confidence is growing, industrial commodities like copper and energy become more useful. At the risk of oversimplification, gold tends to be more highly correlated with bonds while other commodities tend to be more highly correlated with stocks.
Having cited stocks three paragraphs in a row, let’s take a closer look at this asset class from the perspective of inflation protection. Stocks are underappreciated as an inflation hedge if only for the reason we cited above … that when they’re most effective is before inflation is even recognized as a problem.
From a capital perspective, the good news is most any old stocks will do. Just buy the world. The broadest stock fund on the market, VT, will do just fine, especially in combination with gold and other commodities. Stocks can be tweaked with special concentrations, but as we’ve seen, stereotypical inflation plays are not always the most effective; technology stocks led the markets for most of the last decade.
What About Protecting Income?
From an income perspective, we’ll have to dig deeper. Conventional performance analyses and charts emphasize price performance. And the asset class usually associated with income – bonds – is ill-suited to providing inflation protection. And while VT does produce inflation protected income, we can improve on it markedly.
We’ll do this by taking price out of the equation, focusing instead on the income stream. This has the ancillary benefit of excising the trendy emotional aspects of markets … it emphasizes instead the actual cash flow generated. We can isolate the total income return, or implied return, in the sum of dividend yield and dividend growth. In logarithmic form, this sum represents the income return of an investment independent of price appreciation. But it’s not absolute figures we’re interested in – past performance does not imply future return – instead we’re using them as a window into the funds’ selection and weighting protocols to examine how they’ve performed relative to each other, noting that these protocols tend to be enduring features of the funds.
The justification for summing (in log space) the yield and income growth rate and calling it an internal or implied return may not be immediately apparent. In the long run, if the income grows at a given rate, the capital (price) must do likewise in order for the yield to remain constant. It’s fair to regard it as a deeper look into an investment’s performance independent of fickle price displacements.
Let’s start by dividing the world stock market into its US and XS (ex-US) components. VT neatly divides into these two parts with VTI and VXUS respectively. We do this because most other stock funds available to US investors are targeted to one or the other of these two geographical divisions and we would like to have a benchmark for each. At present, the US represents roughly 60% of world market cap and the rest of the world, XS, 40%. Be aware that this is emphatically subject to change; at the end of the 1980s Japan alone represented nearly half the world market cap.
So let’s take a look at some income-oriented stock funds. They come in basically two flavors … those that emphasize current (near term) income and those that emphasize growth of income. The former presumably sacrifice growth of income in favor of near term yield and the latter near term yield in favor of growth of income. As we will see, the tradeoff is far from inviolable. We’ve started with a selection of some of the most highly rated and recommended dividend funds and then applied our income stream analysis.
US Funds
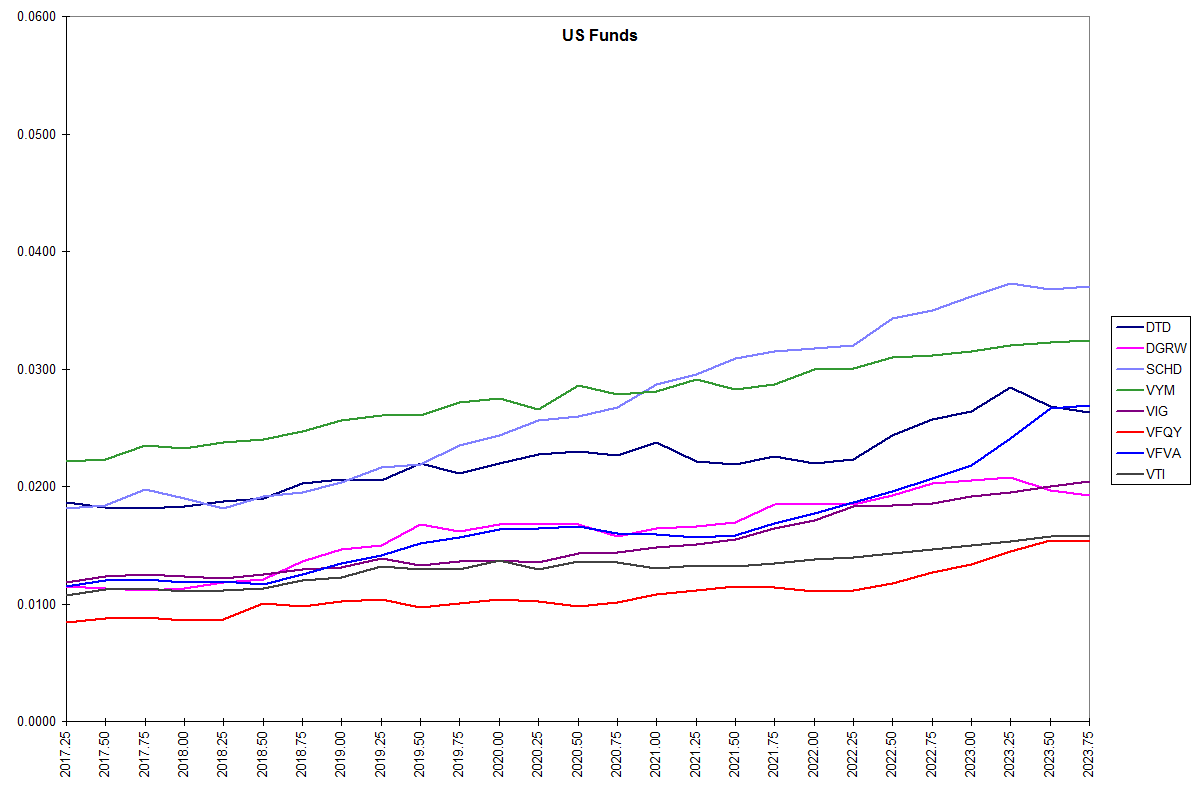
First up, US dividend funds. The above chart plots the annual dividend rate per share of seven top funds, five of which are expressly dividend oriented, along with the comprehensive US total stock market index fund VTI for reference.
One is the WisdomTree US Dividend Fund, DTD. This is the first instance of the weakness of the tradeoff … DTD yields more than a percent higher than the overall market but has grown its dividends at the same rate. It essentially represents the entire US stock market weighted by cash dividends and covers several hundred stocks, making it an ideal core US dividend fund.
Next, the Vanguard High Dividend Yield fund VYM. It essentially covers the highest yielding half of dividend paying US stocks, weighted by market cap. Here we have a twofer, a fund nominally emphasizing near term yield, yet one which has outperformed most of its peers in growth of that yield. It is one of only two funds to appear on both of Morningstar’s John Reckenthaler’s short lists of top funds for current income and for income growth.
(Note Reckenthaler’s use of the term “income growth” differs from ours in that it is the current yield obtained on shares bought ten years ago, not a growth rate as such.)
The chart also plots the dividend growth standard bearer, VIG, versus VTI. It also includes WisdomTree’s dividend growth fund DGRW. Here we do in fact see evidence of faster dividend growth than the broad market.
The Schwab US Dividend Fund, SCHD has defied the tradeoff assumption in spades. Despite being marketed as neither a “high dividend” nor “dividend growth” fund, it has both carried a higher income yield than most dedicated high dividend funds and a higher income growth rate than most dedicated dividend growth funds. I chalk this up mostly to its use of a cash flow to total debt parameter in addition to dividend yield, the former reflecting the capacity of companies to maintain and grow dividends. This makes it a quasi-active fund. A common weakness of funds marketed as dividend growth vehicles is that they rely heavily or solely on historical dividend growth in their stock selections. Funds that look deeper more effectively consider future dividend growth potential. It’s a difference in philosophy … the efficient market hypothesis says you can’t beat a passive index so why bother, versus the evidence that markets are less than efficient and that intelligent selection and weighting can add value, as shown by this fund.
So why not just buy this fund and forget the rest? The index it tracks is limited to just 100 stocks, with roughly 40% of assets in the top 10, making it more of a specialty than a core holding. As the assets of this already-near $50B fund grow further, the possibility exists that its performance begins to falter as it holds an increasingly larger share of its components’ total market caps. I would rather see it double or quadruple the number of stocks, even if it meant a couple more basis points of expense ratio, and use its secret sauce as more of a weighting factor than a cutoff factor, broadening its base for more sustainable performance. Meanwhile, investors can broaden their own by including other funds on the list.
One way to do this is by combining the high dividend fund VYM with two other funds that have shown high dividend growth, each covering several hundred stocks. These two others are the actively managed Vanguard quality and value factor funds VFQY and VFVA. Both have turned in impressive dividend growth and can be regarded as complementary to each other in light of extended stretches where the market favors one style over another, but the latter – not even marketed as a dividend fund – has had not only a respectable yield but the highest dividend growth of all the funds I’ve analyzed. I especially want to call attention to the surge in dividends in both during the recent acceleration of inflation, highlighting the potential for a well managed stock fund to contribute powerful inflation protection to a stream of income. These two funds also have a pronounced small cap tilt that complements the large cap orientation of the dividend focused funds.
XS Funds

Next up, XS dividend funds. For this group our benchmark is the whole-world-except-for-the-US index fund VXUS. We look first at the WisdomTree World Ex-US Dividend Growth Fund, DNL. The fund itself has shown impressive dividend growth, especially given almost none in its universe, but has been inconsistent. We also see evidence of the classic tradeoff between yield and growth. The Northern Trust International Quality Dividend fund IQDF further highlights this … the fund sports the highest current yield of the funds I’ve analyzed but has shown almost no income growth. To get the best of both worlds, investors can combine them.
(You may have noticed that as a group the income stream from XS funds is considerably more volatile than for the US funds. This is largely a consequence of swings in the exchange value of the dollar. In addition the yields of the XS group considerably exceed those of the US, reflecting much higher US stock valuations.)
Schwab’s XS counterpart to SCHD, SCHY, doesn’t have enough history for our full income analysis. It does though share its US counterpart’s cash flow to debt criterion that has likely contributed heavily to its performance, so merits consideration. It however dilutes it with an additional volatility screen, which could help explain relatively unimpressive performance over its short existence, and an arbitrary cap on emerging markets, which might limit its performance going forward. It also distributes only twice a year, a meaningful drawback for income investors.
Also plotted is the XS counterpart to the dividend growth VIG, VIGI. Despite its fine performance history, it’s less suitable as a core fund since unlike most funds in this space, it inexplicably excludes China A shares, most of one of the world’s most important markets, In addition the chart plots the iShares dividend growth fund IGRO.
The final dividend fund in our lineup is Vanguard’s XS counterpart to VYM, VYMI. This is another tradeoff-defying fund, having a considerably higher income yield and income growth than its benchmark. Another plus to this fund is its exceptionally broad base of well over one thousand stocks. Adding the XS small cap fund VSS – which itself covers several thousand – rounds out the lineup nicely.
Global
With one exception. Several funds exclude REITs, a classic inflation hedge and income investment. For balanced and comprehensive world stock market coverage, add a dedicated global REIT fund such as iShares REET. In our Income VI model portfolio, the REIT exclusion is the same half and half for US & XS, so this global fund makes an ideal complement.
Another classic inflation hedge, commodities, is not known as an income investment, but for futures funds tax rules mandate regular distribution of gains, making funds like COMT candidates for inclusion as well.
To sum up our review of income and growth of income, the following tables show the figures for US and XS funds evaluated from 2017 through 2023. Yield is the current yield as of the end of the period, Growth is the average growth rate of cash dividends, moderately weighted towards the most recent data, and Return is the total income return.
US Funds
|
ETF |
Yield |
Growth |
Return |
|
DTD |
0.0270 |
0.0561 |
0.0831 |
|
DGRW |
0.0200 |
0.0814 |
0.1014 |
|
SCHD |
0.0393 |
0.1168 |
0.1560 |
|
VYM |
0.0334 |
0.0570 |
0.0904 |
|
VIG |
0.0214 |
0.0874 |
0.1087 |
|
VFQY |
0.0161 |
0.0908 |
0.1069 |
|
VFVA |
0.0287 |
0.1323 |
0.1610 |
|
VTI |
0.0162 |
0.0561 |
0.0723 |
XS Funds
|
ETF |
Yield |
Growth |
Return |
|
DNL |
0.0211 |
0.0521 |
0.0733 |
|
IQDF |
0.0488 |
0.0121 |
0.0609 |
|
VYMI |
0.0476 |
0.0672 |
0.1148 |
|
VIGI |
0.0233 |
0.0824 |
0.1057 |
|
IGRO |
0.0281 |
0.0523 |
0.0804 |
|
SCHY |
0.0396 |
– |
– |
|
VSS |
0.0323 |
0.0194 |
0.0517 |
|
VXUS |
0.0315 |
0.0281 |
0.0596 |
Wrap
Some practical examples of portfolios incorporating these considerations are listed in Financology Model Portfolios.