Let’s take a long view of stock and bond valuations. We’ve often talked about how Synthetic Systems targets the middle ground between very short and very long term trends, most recently in the comments following the last post. The working assumption is that the SS user sets broad target allocations based on a long term market outlook along with personal circumstances and goals, with SS serving to suggest cyclical outperformance opportunities from over and under weighting relative to those long term targets. So what about those very long trends that SS doesn’t cover?
Valuations, while widely acknowledged to be of little value over the short to medium term, are the best predictors of long term returns. One way of measuring valuations is by asking the question: How much do I have to pay for a dollar of yield?
The following charts address that.
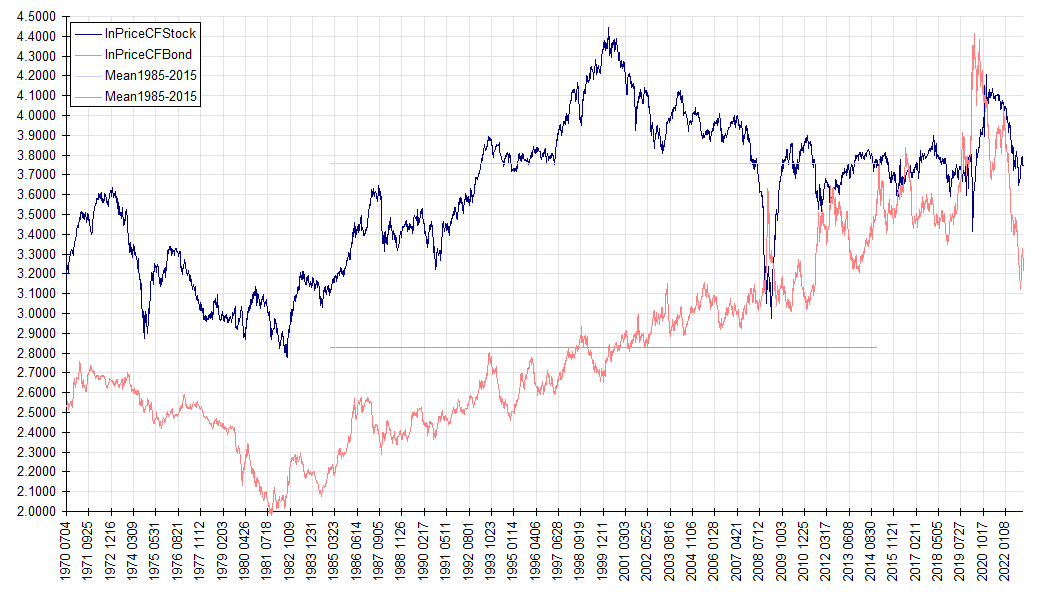
The above looks at stocks and treasuries from mid 1970 to the end of 2022. The striking feature of the treasury plot is a four decade bull market beginning late 1981 and ending in a blowoff top in late 2020. The vertical axis is natural log, so even fairly small looking changes correspond to big price intervals. All told, from 2.0 to 4.4 is an e2.4 times increase … a factor of over 11. And this is merely how much investors paid for the same dollar of yield.
Looking more closely at the past few years, we see another notable feature. The decline in bonds far exceeds the decline in stocks. I’ve referred to this qualitatively in recent posts. We can also see that bonds have been leading stocks. They rose first, peaked first, and declined first. This suggests that stocks have some downside catching up to do.
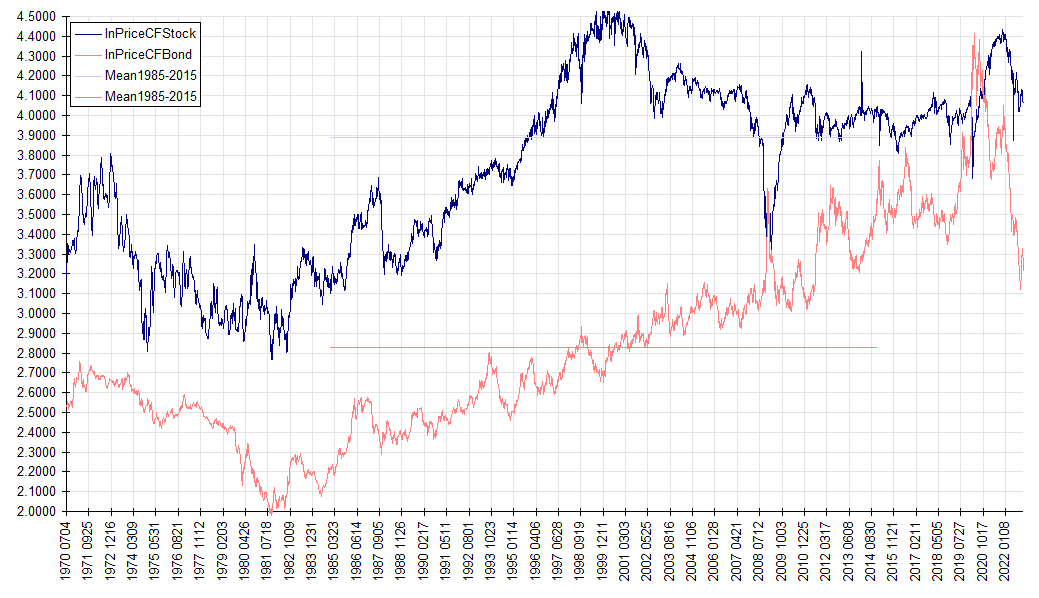
Next let’s look at the same chart except this time the stocks plot is restricted to US stocks. Even after the bear declines of 2022, US stock valuations remain well above the thirty year mean (1985-2015) designated by the straight line. And this mean, being centered on the 2000 bubble, is itself well above the longer term average. It is from evidence like this that I conclude that exUS stocks broadly have brighter years ahead than their US counterparts and overweight exUS relative to US.