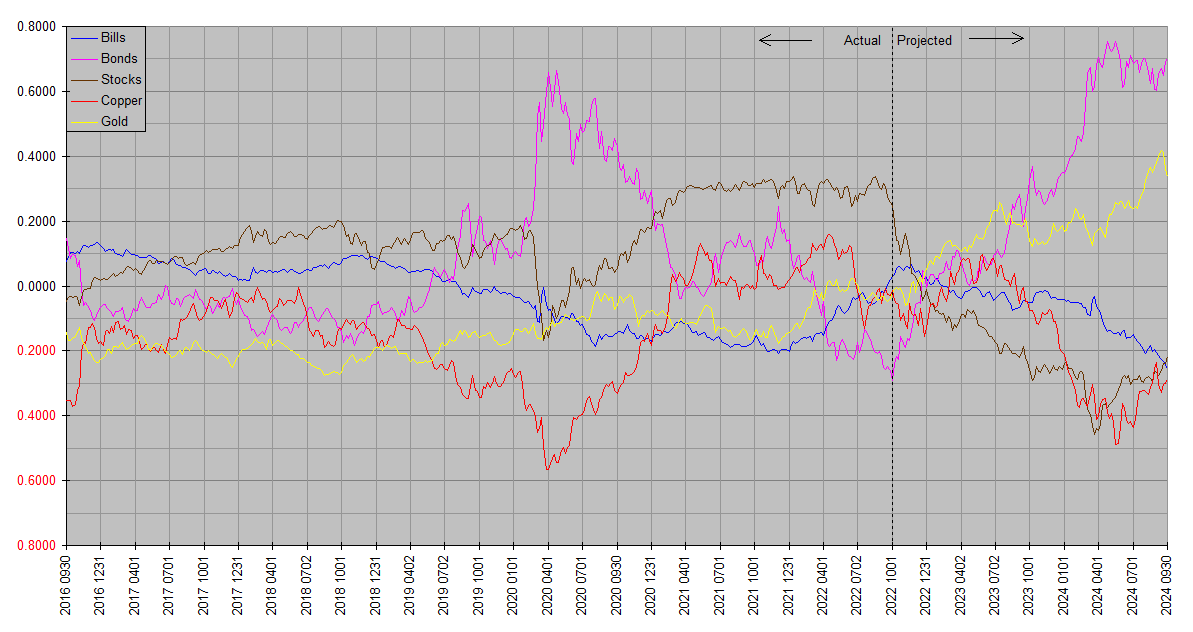
Synthetic Systems is a computer forecasting model covering five asset classes: Treasury bills, Treasury bonds, stocks, copper & gold. The plots are all on the same basis so as to be directly comparable – total return. So the slope of one asset rising more than another indicates outperformance, and vice versa. Plots are in natural log space so that the same vertical increment means the same proportional (percentage) increase regardless of vertical position. The total returns are not denominated in dollars or any other currency, but are relative to each other.
Bills refers to US Treasury securities of effectively zero maturity and duration, similar to a Treasury money market or ultrashort bond fund. Bonds refers to US Treasury securities of effectively infinite maturity (duration reciprocal of yield), but approximates the returns of real world extended duration Treasury funds like EDV, and to lesser extent VGLT and TLT. A broad UST fund like GOVT is around midway between Bills and Bonds. Stocks refers to the entire asset class (not just US or any one country). Copper and Gold represent the respective elementary commodities, except to note that copper is broadly indicative of physical commodities as a class and suggestive of trends in goods and services price inflation.
The charts are best considered together. Annual and quarterly charts are respectively grouped together on dedicated pages under Market Analysis to facilitate this. The forecasting accuracy of Synthetic Systems is best evaluated by comparing successive charts, as the “Projected” time frame of an earlier chart slides to the left into the “Actual” time frame of later charts. Moreover, similarities between the latest update and earlier updates indicate areas of greater confidence in contrast to differences which indicate greater uncertainty.
Readers should bear in mind that Synthetic Systems forecasts comprehensively reflect financial and economic forces (e.g inflation, interest rates, monetary policy, money flows, seasonality, natural resources, technology, demographics, the business cycle, global economic trends, consumer sentiment, investor psychology, momentum, mean reversion, etcetera), but do not reflect external noneconomic factors (e.g. natural disasters, pandemics, unexpected geopolitical disruptions) until they are incorporated into the financial and economic sphere. It’s most applicable over time frames from one quarter year to four years … its accuracy is limited by noise and news flow on the shorter time frames and it also does not attempt to model drivers of longer term returns such as valuations.
Readers are encouraged to consider Synthetic Systems forecasts in conjunction with fundamentals and valuations. Synthetic Systems however often forecasts trends long before the fundamentals fall into place; for this reason it’s useful as a medium term planning guide, with the appearance of fundamentals consistent with a Synthetic Systems forecast serving as confirmation, the lack thereof nonconfirmation. Final confirmation occurs when the trend is actually in evidence.
Bill
UK MSM is posting this to the masses:-
Indicating a new austerity period may be around the corner, Levelling Up Secretary Simon Clarke, one of the PM’s inner circle, has told The Times British people need to expect significant cuts in public spending because for too long Western people have been living in a “fool’s paradise”.
As in it’s the people’s fault … having nothing to do with government policy? Alas … politicians are the same everywhere!
No, we didn’t overspend, overregulate, overinflate, overborrow, overreach … it’s the people’s fault for being too optimistic!
Alas the part about austerity may be the truth. Possibly to a lesser degree, stateside as well…
BTW I moved some of your replies to try and collect bits of the same topic together … if you don’t see a reply you posted, check under the Pounds & Gilts article.
Thank you, Bill!
A few words about the Bonds plot SS believes is bottoming right now. It’s a long standing projection, dating back at least to the beginning of 2021, that Bonds would reach a low in the vicinity of October 1, 2022. That’s today. These historical projections are collected on the Annual and Quarterly pages under Market Analysis on the site menu.
The mid year run 2022.50 is the lone exception. After having stuck to the October 1 date for several quarters, SS appeared to change its mind. It moved the low ahead to around July 1. This proved inaccurate, but not surprisingly so … as we’ve observed since inception, consistency through successive updates correlates with forecast confidence. No forecast is ever certain, but dithering through successive runs indicates greater uncertainty. This aspect of Synthetic Systems is one reason I maintain series of charts under the Market Analysis page … it facilitates comparison of successive forecasts as well as outcomes.
What may have led to the mid year anomaly? There is no way to know for sure, but I suspect the immediately preceding crash in copper prices was a major contributor. It itself was not foreseen in earlier forecasts, and the unexpected development probably signaled the need for a mid course correction. As it turned out however, that was not the case and within the next few weeks SS realized it and returned to its original position.
This leaves the current forecast supported by several preceding runs with the one exception. I interpret this as suggesting a higher than normal level of confidence. By no means certainty, but less uncertainty than usual. In addition a supporting fundamental picture has been developing … we have remarked on several pieces of this picture in recent weeks. All things considered, I think the case is strong that bonds will outperform stocks over the coming quarters, and that a major low in bonds will turn out to have been not too far from October 1, 2022.
re the UK: of course they have to cut back on public services. that will offset at least part of the cost of getting rid of the highest tax bracket.
also re cb’s: the boj broke precedent to intervene in the currency market to support the yen, which has cratered this year. then last week the boe did an abrupt about face from qt to qe at midday in the midst of a gilts auction. the pension system was about to break.
remember all the people who said the Fed would raise rates until something broke. I think things are breaking and that supports a bond rally.
Absolutely, JK … there are multiple forces all pulling in the direction of a bond rally. They’re deeply oversold. The dollar has been very strong. Copper prices have come down (bond prices are strongly inversely correlated with copper). In a bit of news, the UK has thrown in the towel on part of the proposed tax cut package (the highest bracket elimination … regardless of whether it has long term merit, it was extraordinarily poorly timed).
To play devil’s advocate, a big remaining swing factor is the course of stock prices. If stocks shoot heavenward, the easing of financial conditions will undermine the Fed’s progress on its inflation fight, leaving the door open to still further hikes and bond price declines. This will be underscored by what happens on the employment front … although it’s not the main thing the Fed is watching right now, it still makes a difference whether it’s supportive. It would be really hard for the Fed to justify a pivot with both inflation and employment running hot.
The argument has been made that the Fed will hike until something breaks … and that the turmoil in the Japanese and British currency and bond markets is the thing that broke. But if stocks are soaring that’s quite a market judgment … you have to wonder if they’re not yet broke enough.
Supporting our purely technical SS outlook for bonds outperforming stocks over the coming quarters, we have another excellent piece of fundamental analysis from Michael Lebowitz at RIA:
Goodbye TINA – Hello BAAA
Among the several arguments Lebowitz presents, one concludes “If the strong correlation holds, bonds (TLT) may significantly outperform stocks (SPY) over the next two years.” This is remarkably consistent with our Synthetic Systems outlook.
Bear in mind that the SS Bonds plot is of theoretical perpetual Treasuries, and most Treasury portfolios won’t be as extreme. The real world fund EDV – a portfolio of 20-30 year zeroes – is very close. TLT and VGLT would be a bit milder. The one most suitable for core allocations, GOVT, is milder still due to its wide spectrum of maturities, occupying a middle ground between the Bills and Bonds plots.