Well the midpoint of 2022 has finally arrived and with it the mid year Synthetic Systems update. With this update we also have a substantial upgrade in Synthetic Systems. The version now appearing on the pages of the Market Analysis section changes from what we’ve referred to in prior posts as SS to S or “Quick” Synthetic Systems. The changes are discussed in more detail in Synthetic Systems Update and Synthetic Systems Comparison.
For comparison below is all three versions updated to mid year. The differences between them highlight areas of greatest uncertainty. S is the new version we’ll be using as the standard going forward, SS is the version used before and appearing in the previous charts archived under Market Analysis, SSS is the “Symmetric Synthetic Systems” introduced in Systems Beta.
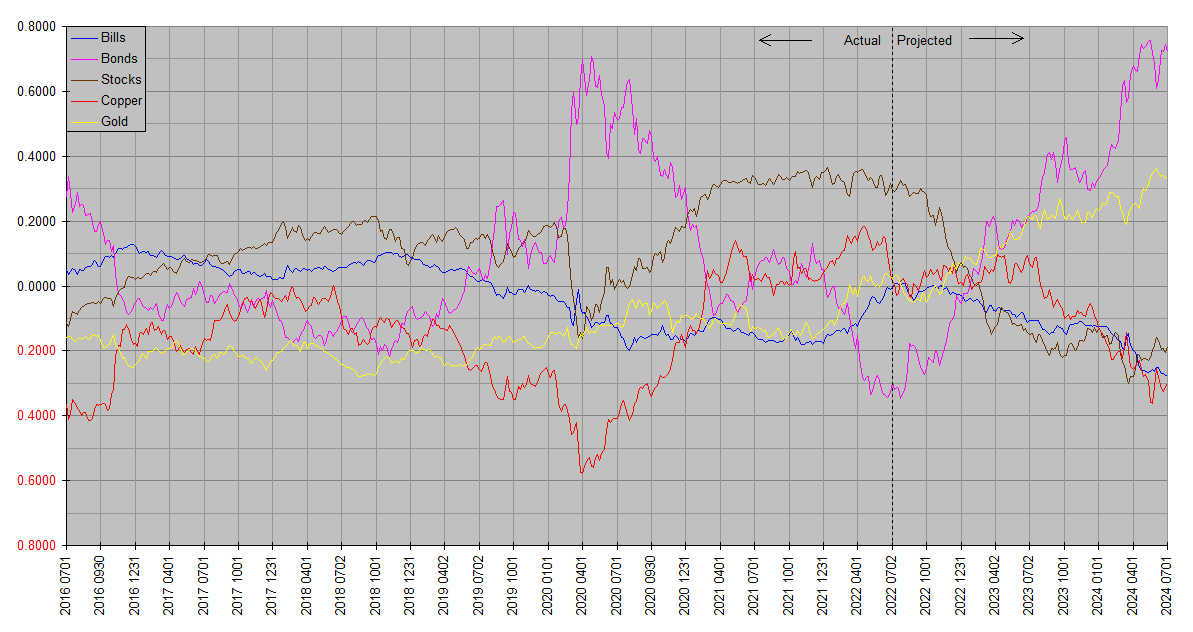
S
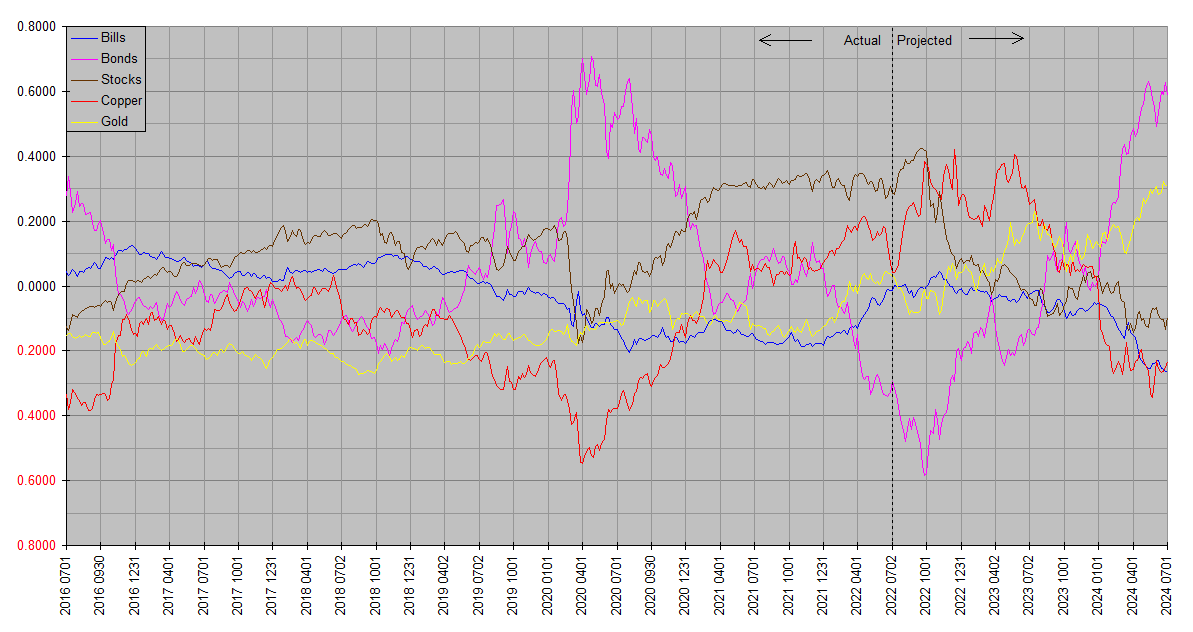
SS
SSS

thanks, bill. always appreciated.
Just a few general remarks on the charts. Referring particularly to the top one, the outlook in the asset world is much the opposite of what we’ve been seeing in the world of goods and services: Deflationary … gold beating copper, bonds beating stocks … in a big way. The bull market in the dollar itself is not expected to continue though … this rally was responsible for most nominal stock price declines until recently, but stocks themselves appear poised to pick up the bear baton.
Notice though that while the bear market in stocks is expected to go on for quite a while, the difference between Stocks and Bills line only falls steeply for about three quarters … after which nominal stocks declines are no longer in free fall.
Another noteworthy feature is the change in the copper outlook from the run of the same version on 0611 … only three weeks earlier. While the other plots are little changed, the Copper plot has changed markedly. This is a sign of uncertainty … the outlook for copper and by extension most of the physical commodities complex – particularly in the near term – is volatile and uncertain. In contrast the longer term view remains more stable at bearish.
Thank you for this update, Bill. I find the differences between the three Systems fascinating! It’ll be interesting to compare them over the next several quarters/years as things play out in real time.
Could I ask a dumb question please? I’m trying to understand how the Fed’s QE and QT is reflected in Systems. I’ve read your explanion of the asset classes in Market Analysis and tried to mentally overlay periods of tightening and easing with your charts but I’m a bear of very little brain. If the Fed is going to pivot what would that look like in Systems?
That’s actually a very good question, Shiny! If you’ve been following my comments on Fed policy both here and iTulip you may remember an occasional remark to the effect that following the Fed is generally a waste of time for most investors like us. I only do it as a critic … not to inform my investments.
Why? The bond market tells us everything we can know about it. The Treasury yield curve is extraordinarily efficient at discounting Fed policy prospects. Not only that, but the Fed itself follows the bond market at least as much as the other way around.
So Synthetic Systems doesn’t attempt to follow Fed rate or quantitative policy directly. It gets all its information about the Fed via the bond market.
Bill said: “The bull market in the dollar itself is not expected to continue though … this rally was responsible for most nominal stock price declines until recently,”
———————————————-
Bill, why do you say the bull dollar rally was responsible for most nominal stock price declines?
1. were not those price declines real as well as nominal?
2. can it be that the nominal stock price declines were responsible for the bull market in the dollar?
They were nominal. Actual stock values held up pretty well. But when the dollar changes in value, prices also change, even if the things being priced don’t.
It’s the opposite of inflation. The actual value of a loaf of bread doesn’t have to change in order for the price to rise. All that’s required is for the pricing unit to shrink. It takes more of the shrunken dollars to buy the same stuff.
The cause of the rise in the value of the dollar was falling bond prices. This meant higher yields. Higher rates made it more attractive to hold dollars and more expensive to be in debt. The increase in the demand to for dollars to repay debt and the decrease in the attractiveness of taking on debt to create dollars resulted in a higher market value for dollars.