I had planned to run only the “quick” SS posted in Markets Update, but due to the weighty implications of the current market juncture also ran the others. Much as we prefer to avoid unnecessary complexity, comparing the versions’ forecasts can give us a sense of where the greatest uncertainties lie. So here are all three together, using the same version nomenclature we used in Systems Beta. They’re all run based on the same data available as of the end of last week.
Bear in mind there is never certainty in predicting the future, especially in financial markets, and even the areas of agreement embed uncertainty, but more disagreement does indicate more uncertainty.
S

SS
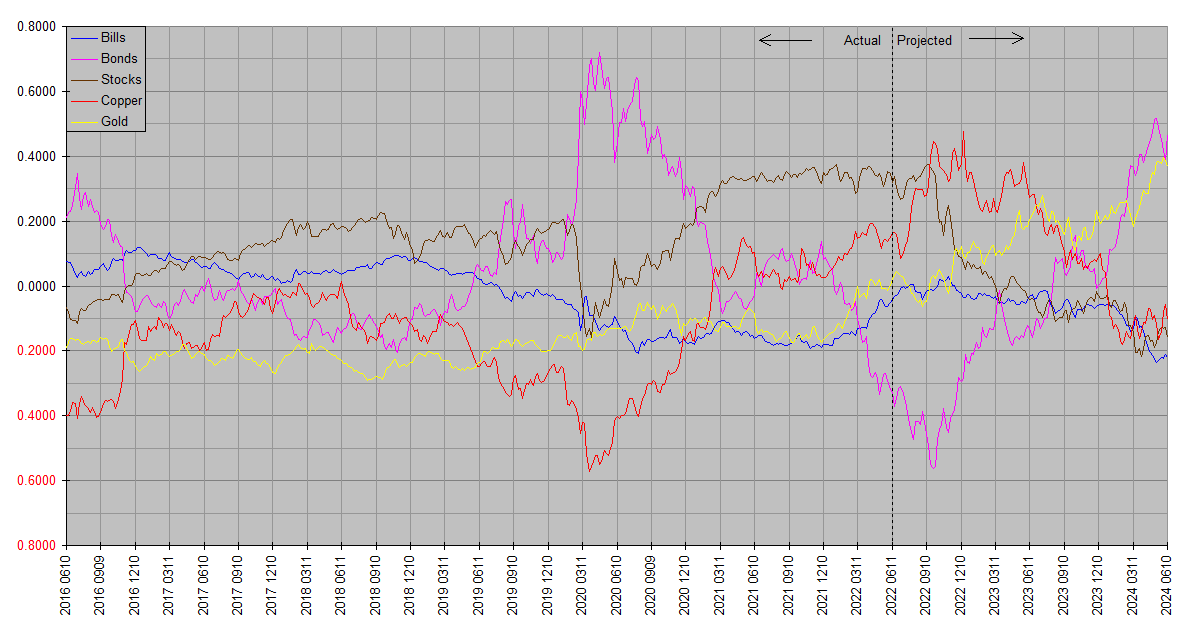
SSS

Thank you for the more detailed update. I have two questions.
First, I look at your SSS forecast and assume that the gold/oil or gold/industrial commodities ratio will increase to a level even beyond where it was in March 2020. Is that interpretation correct?
Second, am I correct in assuming that SSS is not recommending an investment in corporate bonds because long-term Treasury yields will decline during an ongoing market crash which is probably not great for corporate credit spreads?
Thanks, kbird.
First question: Yes. The plots are total return, so not generally just price, but since copper and gold pay no dividends it does boil down to just price. A couple of caveats: Although oil correlates to copper fairly well, especially as the time frame rises, it’s imperfect. And SS is not generally as accurate on magnitude as on timing and direction (of course far from perfect on that as well).
Second question: Well … corporate bonds lie somewhere between Treasury bonds and stocks on the SS plots, depending on credit quality. Gilt-edged corporates would behave closer to Bonds and junkier high yield closer to Stocks. And bear in mind that there’s no need to separately consider price and yield regarding SS plots … since they’re total return that’s all already taken into consideration.
A few comments on the forecast … the outlook for Bonds and Gold looks pretty attractive. I’m now overweight both. But there is a highly plausible fundamental scenario backing it up as well.
I think the bond market especially is underpricing the policy outlook. The Fed has been very vocal about its determination to quell inflation, and there’s a lot of opinion in the financial arena holding that rates will have to rise much more to get the job done. But here at Financology we have not only SS but the FDI as well, and the latter tells us disinflation is in the pipeline. Likely due to the bond market’s already having done so much heavy lifting on the rates front.
If so bond yields are stretched on the high side and prices on the low side, providing a nice tailwind over the coming months. In addition the belated return to normal rates after years of repression may well unravel some excess leverage and speculation. That could prompt a hasty retreat in rates and a surge in Treasury prices.
Again I don’t tell SS what to think and don’t even have a way to, so when its opinions and mine come into concord, I feel better about both.
your 10 minute “s” system seems the most accurate over the small sample of the last 19 days.
Haha … I wish I could redefine “statistically significant”, ‘cause that would sure cut down testing time! I did 24 runs over 12 years and felt like that was pushing the limits, and even the last run at 2021.5 wasn’t complete because to test a year’s forecast I’d have needed data through 2022.5. Now I can finally do that.
But as it turns out I’d already settled on “quick” Systems for the mainstay. Using the previously cited testing nomenclature that’s S. SSS tested ever so slightly better, but takes several times longer to run, giving S two big advantages: It will be easier to fine tune and I can much more readily do intra-quarter updates. S is a bit less stable … meaning the forecast changes a little more from quarter to quarter, but given a quarterly update cycle anyway that shouldn’t be a problem. It also has fewer adjustable parameters, making it a little more goof-proof.
Another potential advantage is it has no built-in limits on time frame … the other versions all avoid trying to resolve shorter than about a calendar quarter or longer than four years by design. Markets themselves get too noisy in the very short term and fundamentals and valuations are better at long term forecasting. Focusing on the most useful time frames could make it better where it can contribute most. But once in a while the absence of those limits could be a plus … like for instance over the past 19 days…
We can always still look at other versions for comparisons … having two or three somewhat different forecasts can shed light on where the biggest uncertainties lie.
The next full quarterly update is due tomorrow.
since the economy changes, sometimes relatively rapidly, sometimes slowly, and the importance of e.g. industrial commodities, or even interest rates for that matter, may change in different market regimes, why assume that a static model should perform equally well over long periods of time. [i’m assuming your model doesn’t “learn.” does it?]
it seems to me that different models will perform better during different market regimes. it is not obvious to me what the appropriate time scale would be for testing, and that too probably varies by regime.
a population of models, tweaked in various ways, would allow the selection of that subgroup of models which best represent the current regime, perhaps by looking at markets over the last n months, perhaps instead looking at economy specific factors- interest rates, debt, etc. the hope would be indentifying a subgroup which would do the best job looking forward the next y months.
there’s a life’s work for you, bill.
Ha guess it would be a life’s work! As it stands I’ve been working on these off and on for 28 years. But “learning” was introduced around 2014 … and it was a step up from static models. There was another fundamental change around the same time though, so it’s hard to say how much each contributed. The latest change, especially in the S version, is comparable in scope … actually SSS was the first attempt to directly produce the forecasts you see; prior to that explicit forecasts were essentially a byproduct of estimating current rates of return. Then SSS led to S. Probably the path forward will be built on S, but for the past eight years they’ve all been adaptive systems that learn from experience, so some improvement could take place organically. Only the core concept remains static. It may be approaching the bounds of determinism though … not only is the future inherently indeterminate (as quantum mechanics implies), but impulses from outside the economic and financial world (e.g. the Big One hits California, spooky little nanobots from Wuhan invade our cells) will probably always be impossible to model.
ps you say that sss slightly outperforms s over the long term. it would be interesting to look for the periods of time in which that outperformance occurs. is there something that those periods have in common?
Did you see the numbers? They’re in the linked post … the difference is very slight, and could even reverse when I rerun the last one with the full year’s data.
I didn’t see any pattern in the relative performance. There were periods where they all missed … the forecasts of all three versions for both 2011.5 and 2020.0 missed badly. The second instance was clearly due to having failed to anticipate the corona crash, but I don’t know what happened in the first.