A review of the first quarter century of the millennium
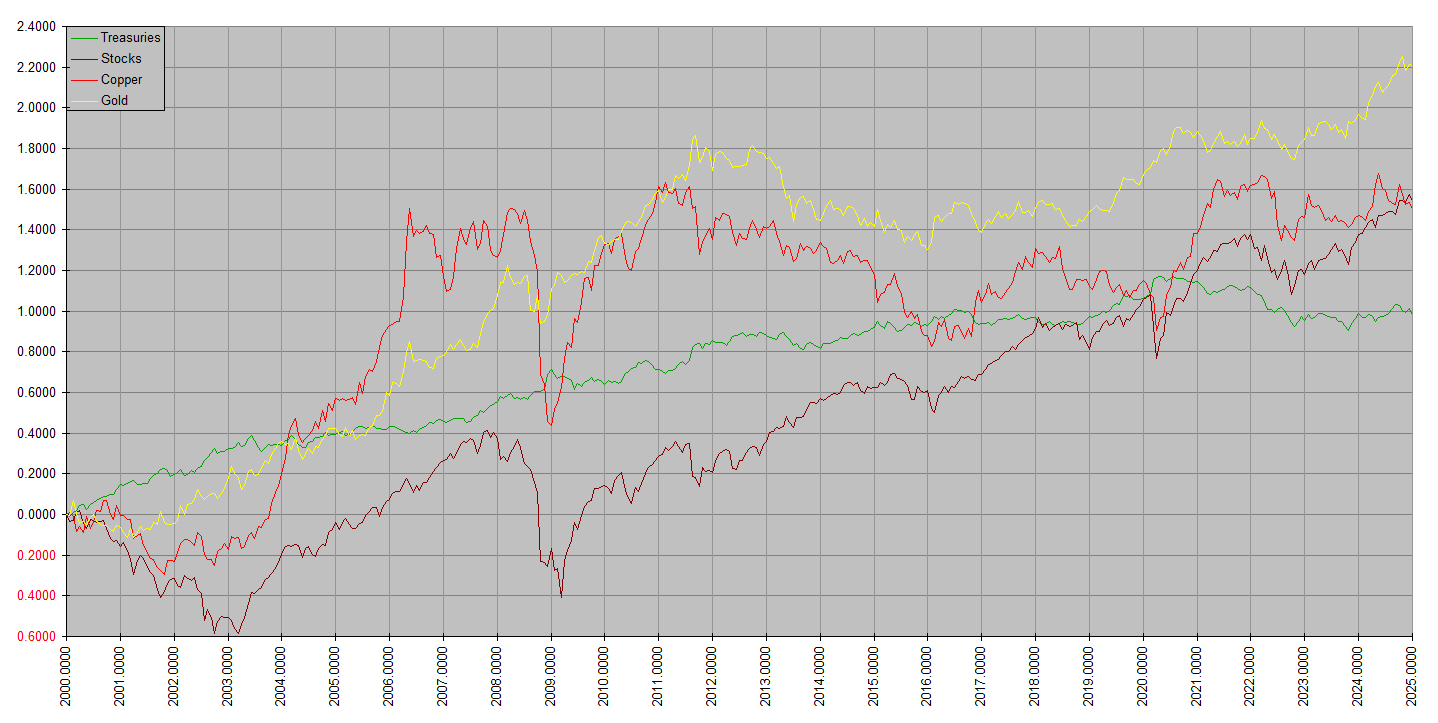
The following chart shows the total returns, in dollars, of the assets tracked by Synthetic Systems since the beginning of 2000. The vertical scale is natural log so that 0 corresponds to e0 = 1 times the starting value. The 2025 value of 2.2 for gold corresponds to an e2.2 times its value at the beginning of 2000, or up by about a factor of 9 times. ($1 grew to $9, $1000 to $9000). The 2025 value of 1.6 for stocks represents a factor of about 5. ($1 grew to $5, $1000 to $5000). Though this may at first seem cumbersome, for our purposes here we don’t care about dollar prices, but rather returns, and the log scale allows the same vertical increment to represent the same return everywhere.
The next chart is similar except uses the same units as SS, emphasizing returns relative to a weighted average, a rough proxy for real returns.
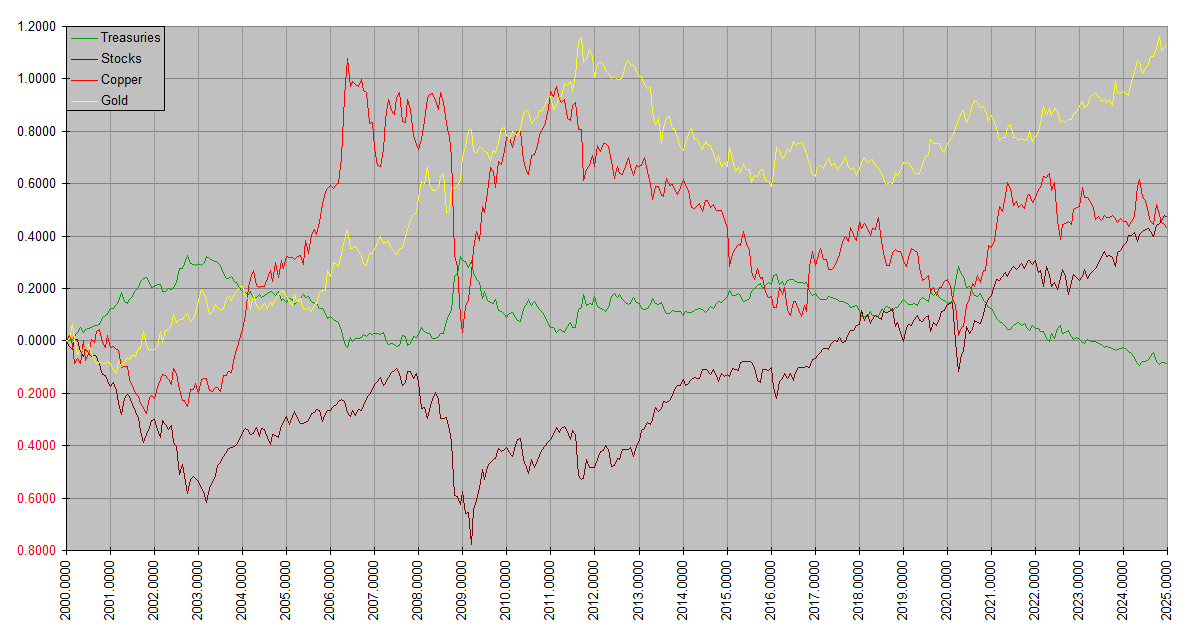
Notice that the relative performances are the same regardless of the choice of units, as they should be.
Returning to nominal dollar basis, the 25 year total return, as a multiple of the starting investment for each is:
Treasuries 2.6783
Stocks 4.6948
Copper 4.5056
Gold 9.0995
Some striking observations … gold outperformed stocks over an entire quarter century. Stocks outperformed copper by only the slightest margin. It’s remarkable that the stocks of world’s public businesses, the asset class “for the long run”, either barely kept pace with or markedly underperformed mere chunks of inert metal. This over a two and a half decade time frame. Stocks didn’t even pull ahead of Treasuries until late 2020. This indicates that most of the returns on stocks in dollars were a figment of a depreciating unit of account (inflation), not a genuine increase in wealth.
Much of this can be attributed to starting valuations. Stocks began the century in rarified territory. Part of it can be attributed to the related state of low dividend yields. So we wouldn’t expect such poor stock performance over the next 25 years … but … oh … wait … here we are again. Stocks are once again trading at very high valuations and low yields.
Year to date price performance:
SPY: 17.09%
VT: 20.80%
MAGS: 25.85%
CPER: 33.93%
IAU: 66.69%
SLV: 133.31%
PLTM: 137.51%
This is especially notable because this period begins after the 25 year period covered in the post (it ends at the beginning of 2025). In other words, despite the corporate media having just woken up to gold’s performance this year, attributing it to current stories like Tariffs or Ukraine or Venezuela, it was already way ahead of stocks at the beginning of the year. Then it leaped ahead from there, or looked at the other way around, stocks fell further behind. As seemingly impressive as their return in dollars has been, in terms of hard money, stocks are crashing … after having been in a 25 year bear market.