The yield curve played a prominent role in our recent Market Outlook. Let’s take a closer look at potential implications.
The yield curve is notorious as the single best predictor of recessions. The last several recessions were all preceded by yield curve inversions and all yield curve inversions were followed by recessions. For our purposes as investors, however, any connection with NBER declarations, employment rates, inflation rates, is of secondary interest at best. We care about recessions in the financial markets. They are typically characterized by declining stock prices and rising bond prices.
A couple disclaimers are in order. First, there is no one “yield curve” aside from the whole continuous range from zero to thirty years maturity. Analysts typically consider selected pairs of points on the curve. This means that “the curve” might be said to be inverted by one criterion and not by another. For this reason you’ll see differing inversion statistics from one analysis to the next. Here we’ll specifically look at the one and ten year yields. Second, for this post we’re focusing on just the period since the beginning of the millennium. We’re giving up a bit of the big picture to facilitate a more detailed closeup of recent history.
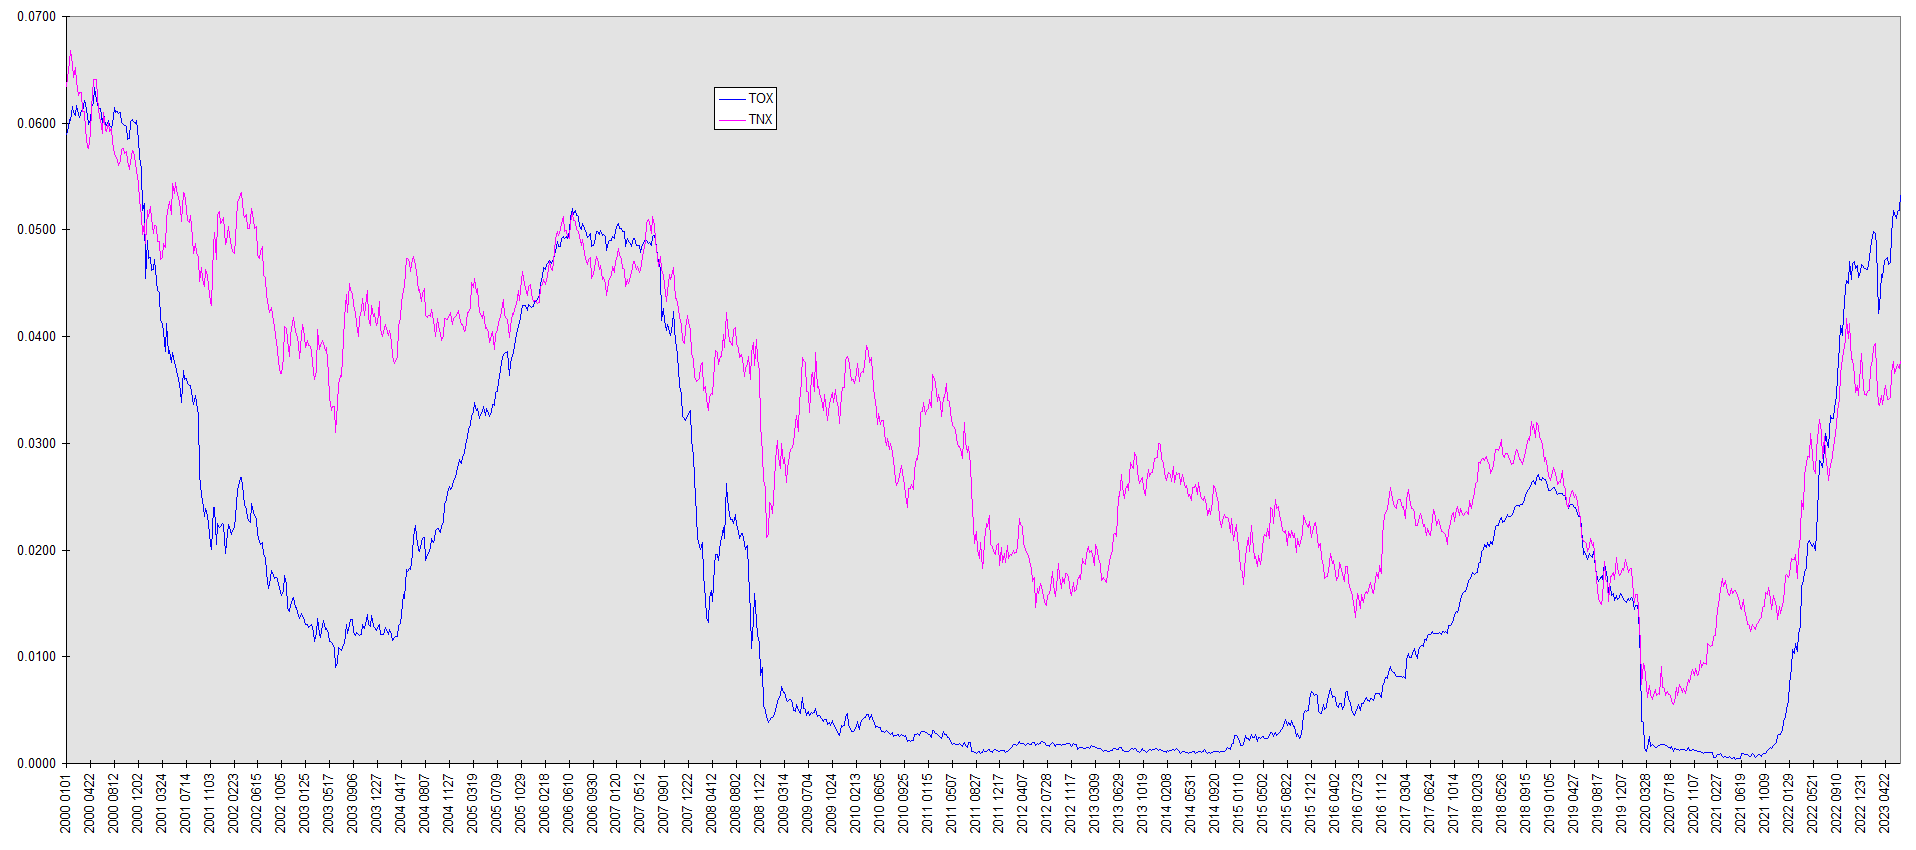
This period captures four significant inversions. The blue line is the one year yield and the red the ten year. On this chart the pair is “inverted” when the red is below the blue.
First inversion
The first inversion of the millennium came shortly after it begun. The ten year yield fell below the one year in March 2000. It briefly bobbed above over the next few months, but generally remained below until the beginning of January 2001. The ten year year yield zigzagged its way down from the beginning of 2000 until mid-June of 2003. In short, Treasuries had a three and a half year bull market. Stocks lost nearly half their dollar value in the two and a half year period from March 2000 to October 2002.
Third inversion
The third inversion occurred in 2019. The 10-1 again bobbed and weaved, but spent much of the year in negative territory. This was followed by a deflationary crash in March 2020. Stocks plunged while treasuries soared. The yield curve had fully uninverted by then though, having been virtually forgotten in the financial media. The coronavirus panic reinforced this amnesia, but the record of the yield curve inversion remained unblemished. Once again a yield curve inversion foretold a recession.
Second inversion
I saved the second for closer examination. The ten year fell below the one year at the beginning of 2006. After briefly coming to the surface in April and May, it again submerged until mid-2007. The curve then uninverted. In September of 2007, the Fed began to cut the Fed funds rate. The next month, in October, stock prices peaked. They then went on to decline by over half by March 2009. The bear market in stocks was matched by a bull market in Treasuries through late 2008, as indicated by the declining ten year yield.
I want to make another important point here. The one year yield went into free fall in June 2007. The first Fed funds cut didn’t come until September. I’ve stressed on many occasions that the great emphasis put on divining Federal Reserve policy decisions in the financial media is worse than useless for most investors. It’s a distraction. Unless you’re sitting at a Wall Street bond trading desk, you’re best off ignoring the Fed media circus. Instead watch the Treasury market. It gets there first. And there is no endless guesswork involved about will they, won’t they, how much, etcetera … the market gives you hard numbers. The market leads, the Fed follows.
Fourth inversion
We saw the mirror image in early 2022. The one year yield began to rise early in the fourth quarter of 2021. The first Fed rate hike came late in the first quarter of the following year.
By the 10-1 metric, the yield curve inverted on July 12, 2022, the first anniversary of which is in a few days. It has remained inverted since, and the depth of the inversion exceeds any other period in the window under consideration. One has to go back over four decades to the early 1980s Volcker era to find anything comparable.
Yet there is one striking difference between the present configuration of the financial markets of today and of then. In 1982, stocks were cheap. Stock prices had been in a secular bear market since 1966. The dividend yield was three to four times its current level, another way of saying that stock prices are now, in relation to dividends paid, three to four times as high as they were the last time a comparable yield curve inversion happened.
The likelihood that the coming market recession will be no more severe than in 1982 is not great.
When it will come is much less clear. The first inversion coincided with the market top in March 2000. The curve uninverted at the beginning of 2001 though, with the bulk of the bear market still ahead. The second inversion began with 2006 and extended until mid-2007. The bear market in stocks didn’t begin until after the curve uninverted and the Fed had started to cut rates. This is but one precedent, but it illustrates that by no means does the absence of a bear market while the curve is inverted signal an all-clear. Nor can Fed rate cuts be counted on to assure rising stock prices. In fact the Fed cut rates through both of these last two major bear markets in stocks.
If this inversion phase were to emulate 2000, the market recession could have already begun, and stocks could resume their downward trek at any time. If it were to echo 2006, the market recession could come as much as two years from the beginning of the inversion. That would place it still as far as a year off. By then the yield curve inversion could well have been forgotten in the financial media. Stock prices could continue to rise for multiple quarters first without the signal having been invalidated.
So while this analysis gives us a broad window of alert, it also gives us some milestones to watch for. In particular neither the beginning of a Fed rate cutting cycle nor the uninversion of the curve signals bullish stock behavior ahead, but rather more likely resumption of the bear market and that most lies ahead. Most of all it tells us that by no means does market action to date justify complacency.
One thought on “Omen”