Let’s take a look at the latest chart of the Financology Dollar Index. Recall that this index tracks the value of the US dollar in terms of human time, the most fundamental unit of value known. It’s essentially equivalent to taking an aggregate of all the world’s goods, services, capital and labor prices in dollar terms and inverting it. It’s the broadest measure of inflation available, a global index of all prices. We take the reciprocal to gauge changes in the value of the US dollar.
We figure the annual rate of change based on the difference between the latest value and an exponential average of all past data using a time constant of one year, to eliminate so called “base effects”, as we have cited in past FDI updates. The latest annualized rate by this measure is -0.1059. Since this is on a natural log scale we exponentiate it to find the continuously compounding rate of -10.05%.
As I’ve pointed out before, there is no unique rate of inflation because it depends on exactly what time frame we choose; we can annualize the past quarter, the past two years … whatever. A simple one year over year is popular since it’s the most current interval that automatically eliminates seasonality, but has fallen under criticism for vulnerability to “base effects”, the fact that the data as of one year ago (the “base”) may itself be displaced from the trend. This is why I usually quote the rate using an exponential one year delay applied to the entire history, as in the above.
There is another option we haven’t discussed before. Looking at the chart below, it’s apparent that inflation has often tended to move in essentially linear trends. The latest such trend is highlighted in red in the chart below. There was an extreme excursion from this trend earlier last year, a surge in the value of the dollar associated with the corona crash followed by a plunge. But the overall trend has remained virtually unchanged since the beginning of 2019.
We can ask: What is the slope of this decline? So long as this trend persists, it’s as accurate a basis as any for saying “the rate of inflation is X”. So I found the difference between the current FDI value and the value as of the beginning of 2019, then annualized it. That rate is -0.1220, or put in percentage terms, the annual rate of change in the value of the US dollar is -11.49%. Put in conventional terms, the rate of inflation is 11.49%.
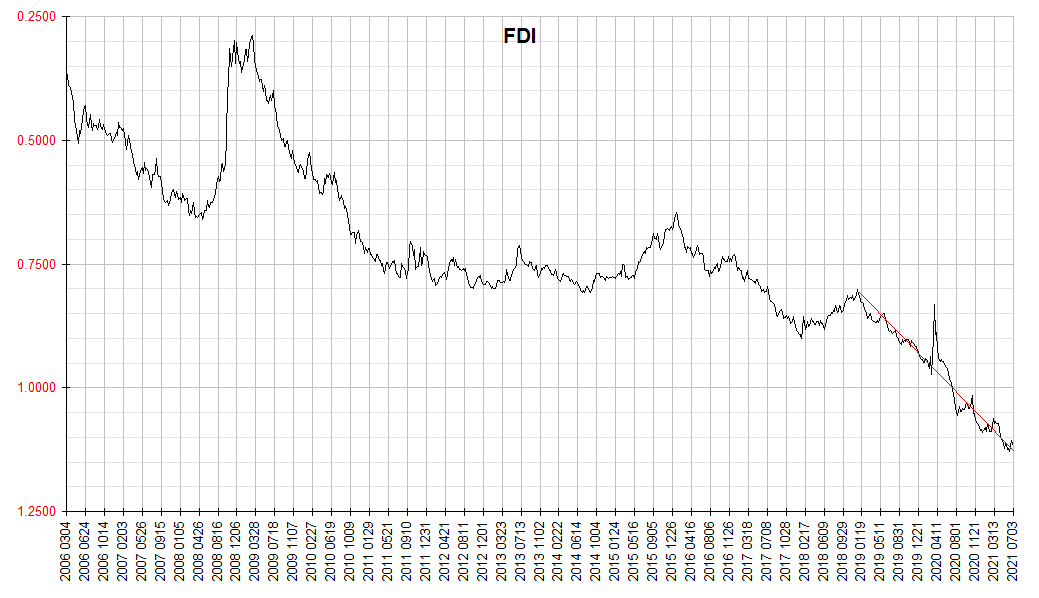
So with the exception of a huge hiccup in the first half of last year, inflation has held right around 11.5% since the beginning of 2019, when the Federal Reserve abandoned its last attempt to normalize interest rates.
Critical thinkers may find curious our claim that the rate of inflation has been overall the same since the beginning of 2019. After all, hasn’t inflation according to stats like the CPI and PCE just taken off over the past few months? Yes it has. But even if it’s assumed that these stats give an accurate reflection of US domestic consumer goods and services prices, the case hasn’t been made that this one subset of prices is itself the last word on inflation. It’s merely been assumed. Here at Financology, we believe that one of the most dangerous mistakes one can make in any arena aspiring to the status of science is to just assume something.
We have a different interpretation. Inflation has been with us for years. But until recently it’s been mostly confined to asset prices. Stocks are “going up”. Realty is ”going up”. Conventional economists don’t count asset prices.
Why? I have yet to hear a serious attempt at justification, so it remains an area that has received virtually no public debate (again, not confidence inspiring for any field of science). My theory is that most of official “economics” is dominated by Washington and Wall Street, constituencies that benefit from inflation, so denial is convenient. So long as it’s confined mostly to asset prices, inflation can be passed off as “prosperity”, and policymakers can continue unchallenged.
This can go on for years, but not indefinitely, as we explained in Flations. Because the aggregate purchasing power of assets must equal the aggregate value of goods and services available for purchase, over time, these manifestations of inflation must converge, so ultimately either asset prices must come down or consumer prices rise to meet them. Or some messy combination of both. This is not something unique to pandemic related shutdowns and reopenings. We saw this happen in the 1920s-1930s, the 1960s-1970s, and again in the 1990s-2000s. Now it’s happening again. When inflation begins to seriously spill over into consumer prices, “ultimately” is arriving.
Meanwhile, the FDI has an interesting message to those who fear inflation is accelerating: It’s not. In recent months the price effects of inflation have been migrating from the area of assets to consumer goods and services. If the rate continues to hold steady, consumer price indices will asymptotically approach a steady state value representing the FDI’s 11.5% less the amount by which the CPI understates consumer price inflation.
One thought on “Inflation Update”