FDI 1900-2000

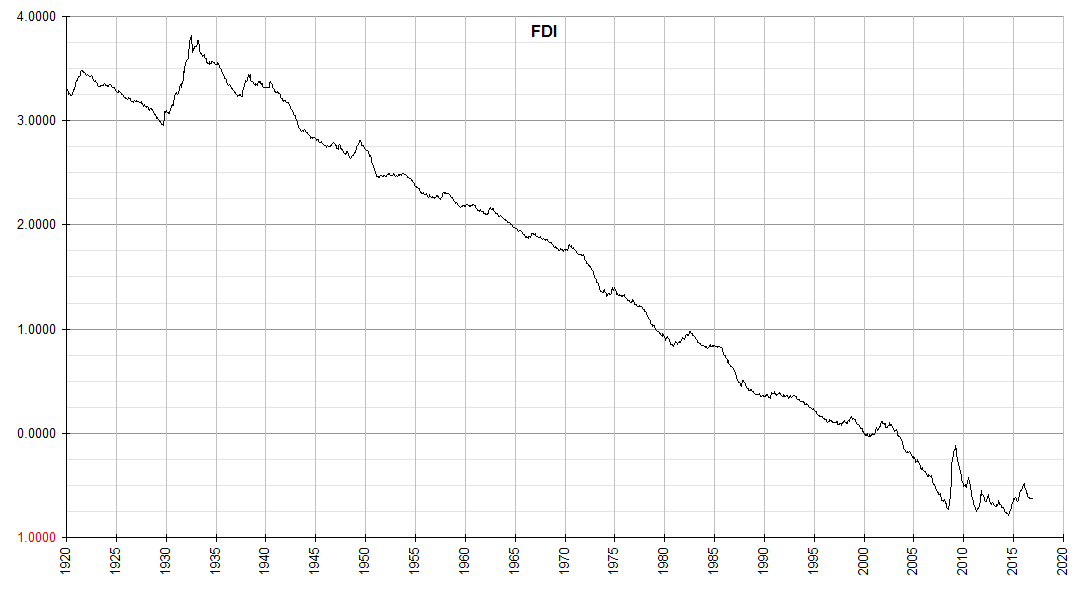
FDI 1920-2020
FDI 20250906
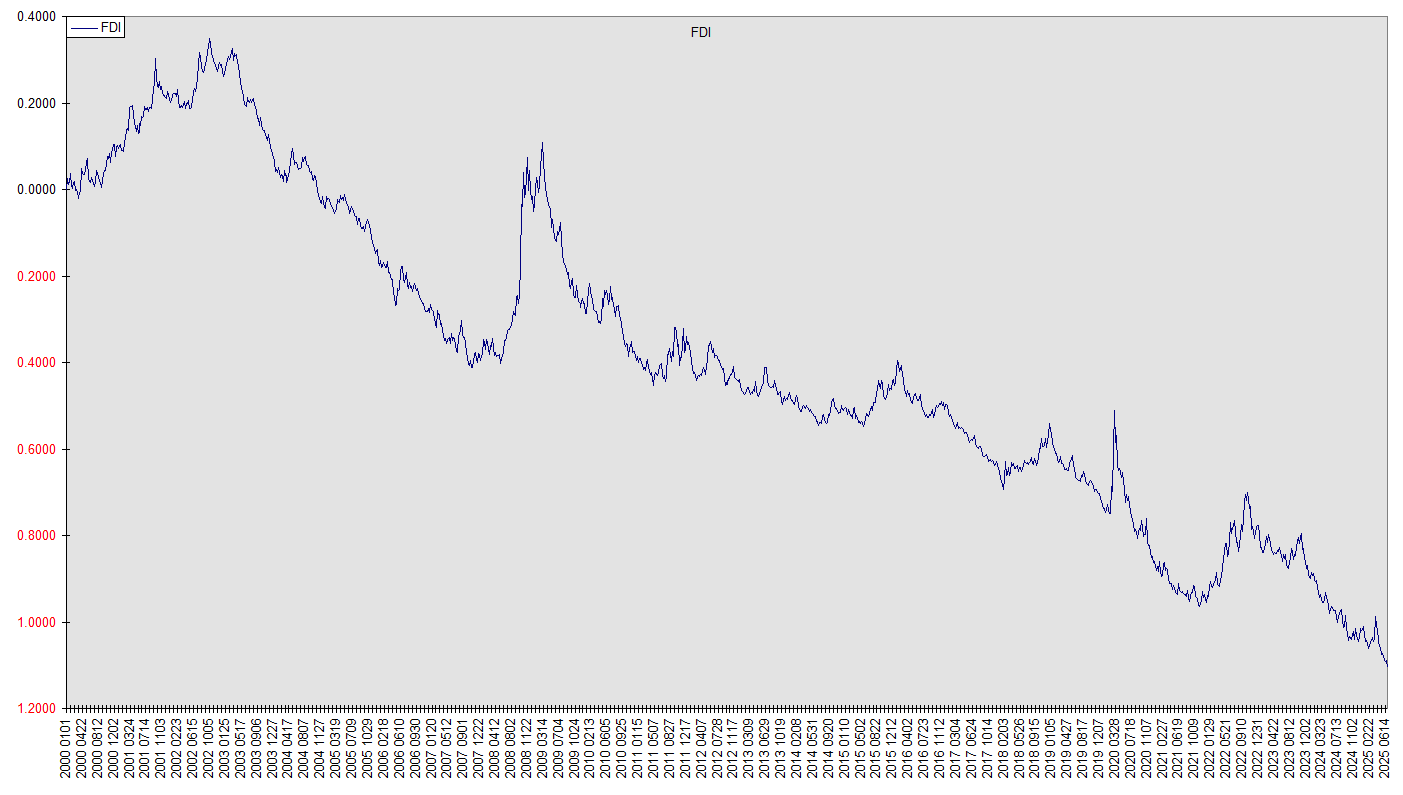
The above charts plot an index of the value of the US dollar in terms of human time. The plots are logarithmic (the natural log of the index for charting purposes), with the index itself referenced to the beginning of 2000.