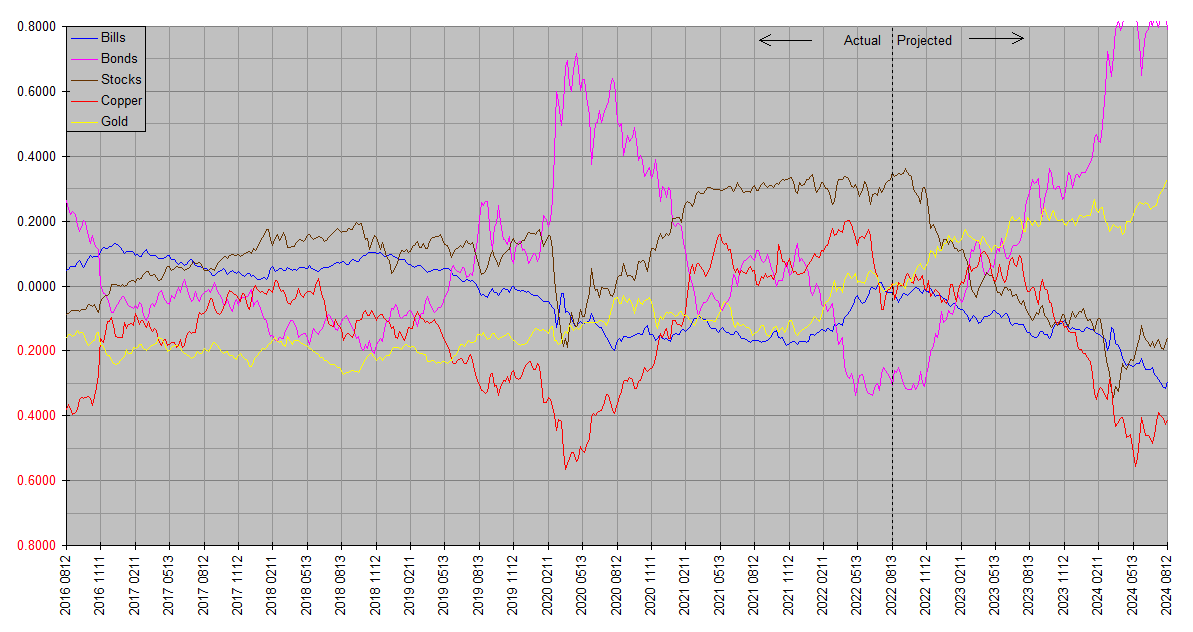
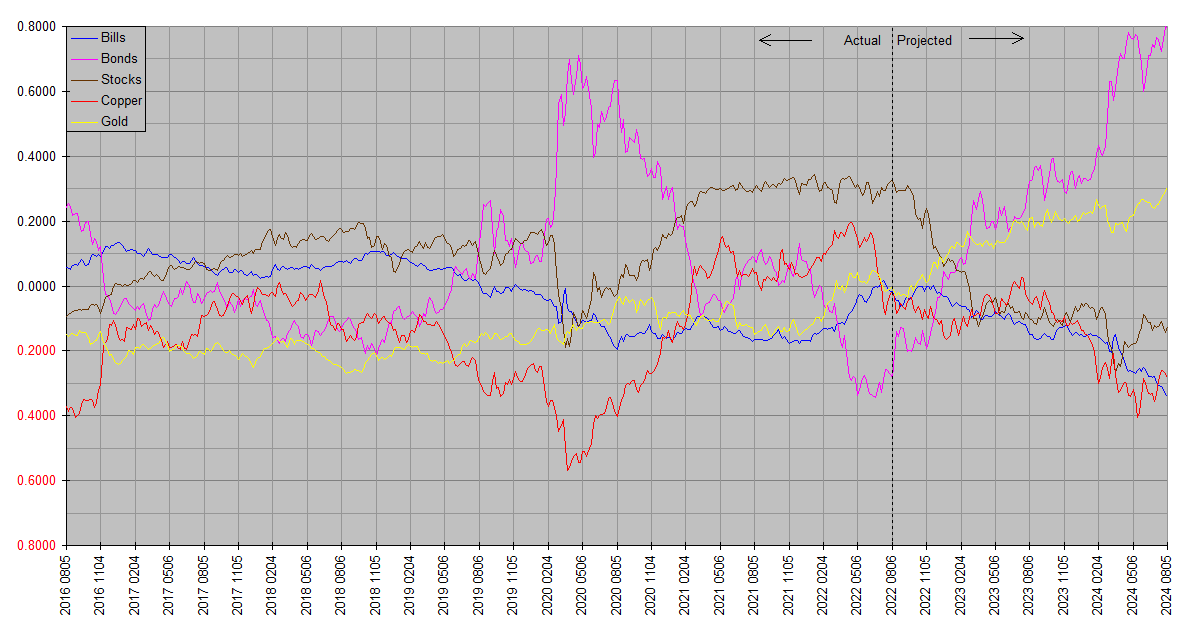
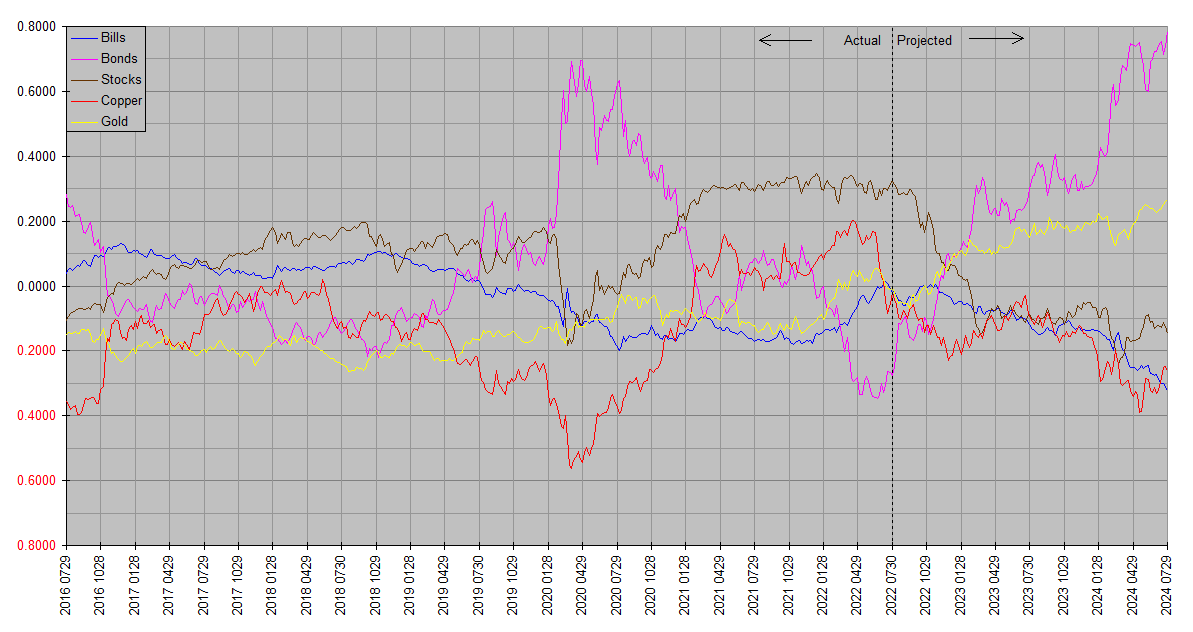
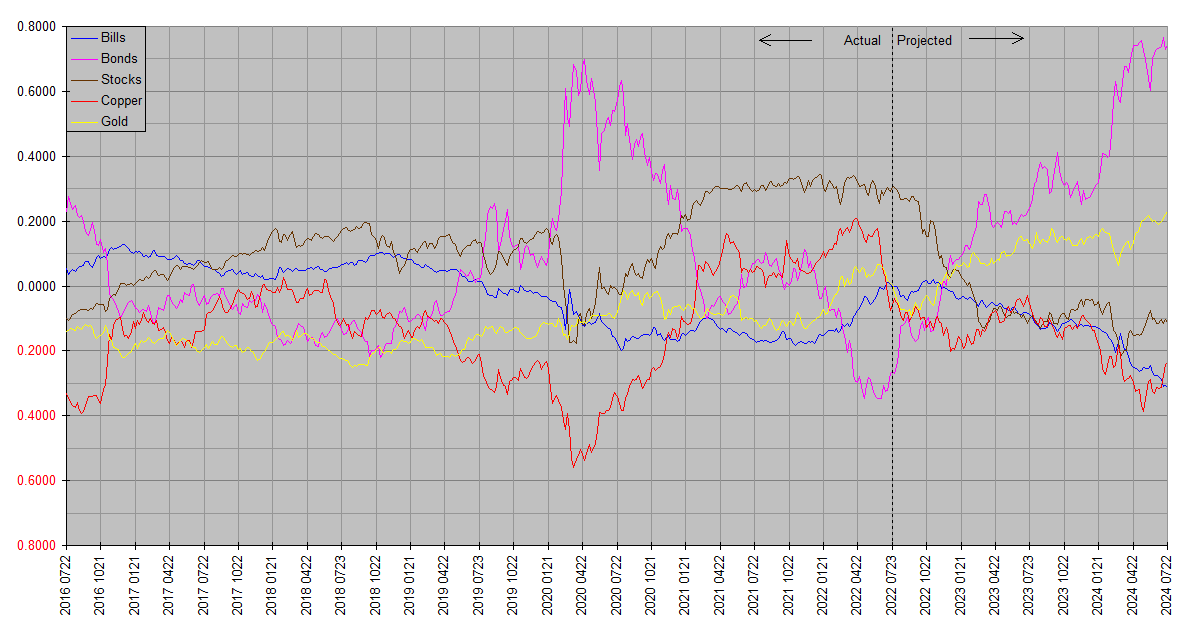
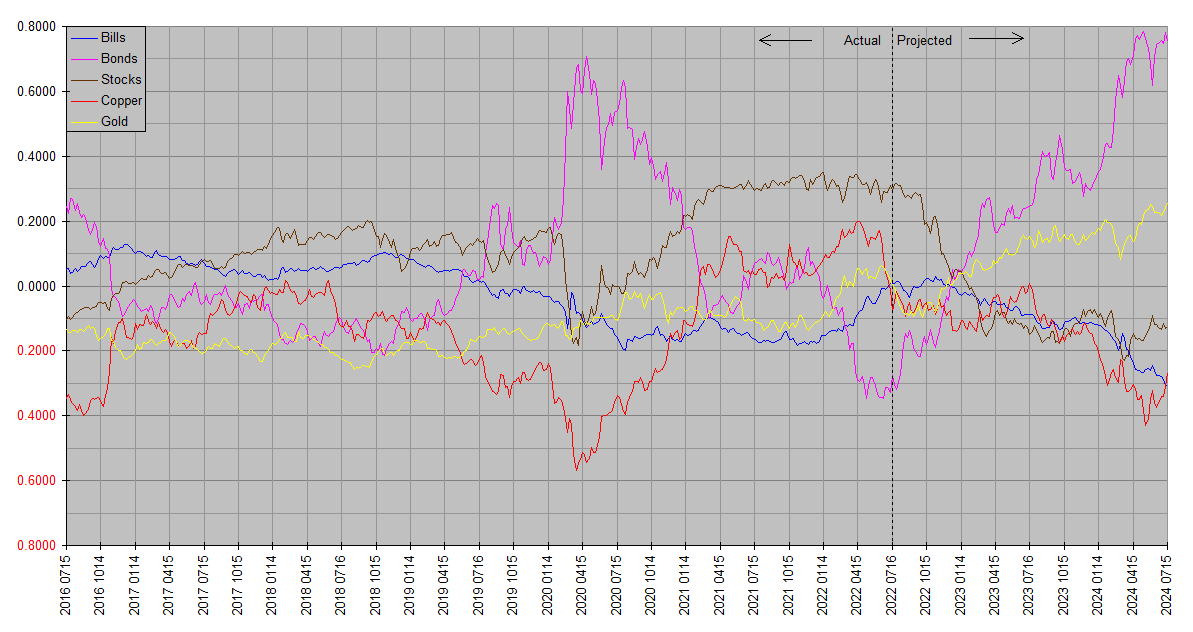
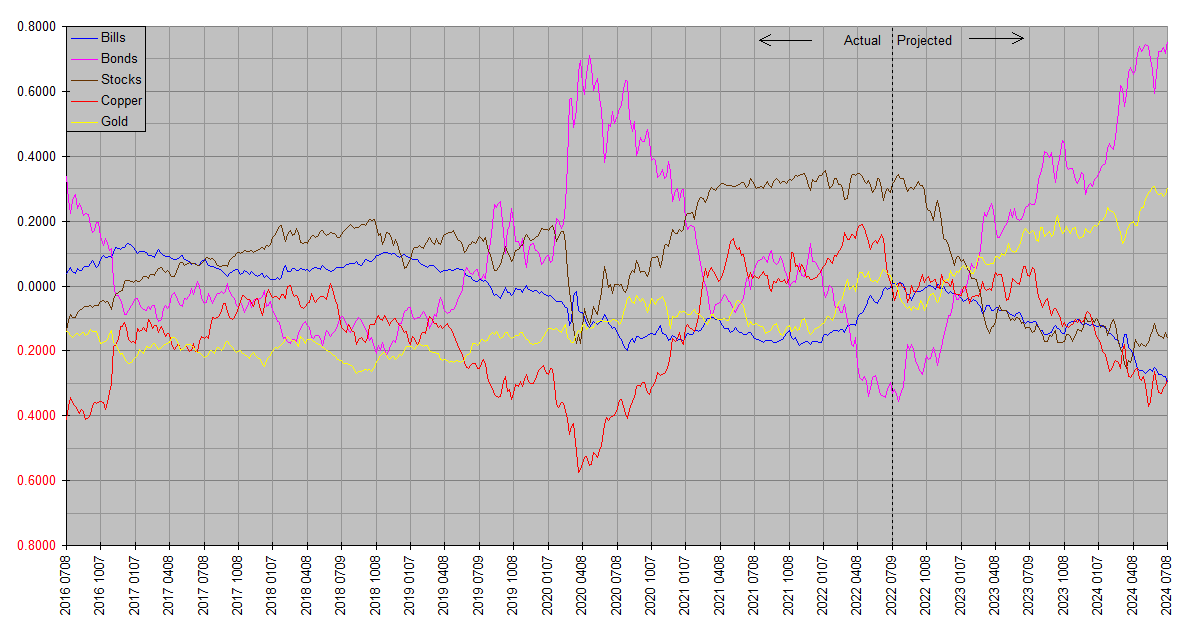
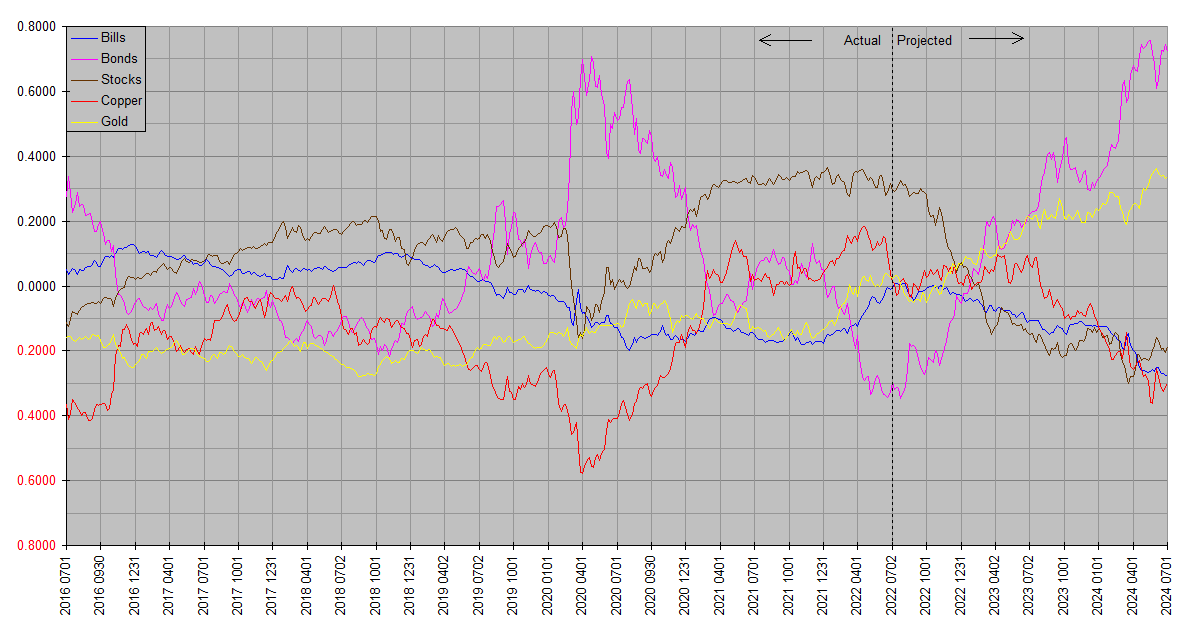
Above are all the weekly SS runs since the last full quarterly update at mid year. Up until this week, the markets have been following the SS script closely and as a result the forecasts have changed very little. Market behavior this week however has departed enough to force a material change in the near term SS outlook. The forecast for the remainder of this quarter now more closely resembles that for the same time frame in the first quarter run 2022.25.
Bill,
I’m looking at the 2022.25 chart. By “same time frame in the first quarter run 2022.25” do you mean the picture from the dotted line at 2022 0401, or what the 3rd quarter showed on that chart?
Thanks!
What the third quarter showed on that chart. In other words, the remainder of the third quarter on the latest run looks a little more like the remainder of third quarter did on the 2022.25 run than it did on last week’s run.
I take it as a sign of greater uncertainty. Although the forecast for the fourth quarter and beyond has been more consistent.
It echoes a debate that’s been running in the financial media … some are now claiming that the breach of the 50% retracement of the bear market in US stocks means the bottom is likely in. From a technical point of view that argument is plausible. Others claim the market is blithely dismissing the Fed’s determination to tighten financial conditions and that the lows are still ahead. SS so far is coming down on the side of the latter. The incremental change in the forecast though does signal that SS is being a little more fluid and a little more open minded about the former.
suggestion: you align the charts at the actual/projected line, so that the dates are offset by varying intervals. i would find it more illuminating if the charts were displayed so that the dates were aligned. it would then be easier to look at how the projections changed and how well they predicted actual performance.
Thanks, JK … good idea. For now I’m working on another enhancement … recall one of the advantages of this simpler quicker model is that it opens up other possibilities for improvement, and there’s one I want to get implemented as soon as possible. Meanwhile I’ll make a point to call attention to notable changes in the forecast as I’ve done here.
Suffice it to say that up until this week the forecasts have been pretty accurate, but that this week’s market action calls that into question going forward. The gist of this post is until further notice, I don’t have much confidence in the forecasts. Once SS loses its lock on the markets it can be a quarter or two before it regains traction.
Some potential good news on the stock price rally. Although some technical indicators like breadth and the clearing of the 50% retracement hurdle suggested more upside to US stock prices, others suggest the rally may be ending. The 200 day moving average has been stiff upside resistance. And VXUS – the world market ex the US – has been sharply underperforming VTI – its US counterpart. Indeed, unlike the the US stock market, the exUS stock market is still is well below its early June high. This divergence has preceded US stock selloffs in the past. While Bonds have yet to demonstrate the rally SS has penciled in, Stocks may not be as off track as it appeared for the anticipated resumption of their bear market.