The initial round of testing for two new versions of Synthetic Systems is complete. For now let’s call the version we’ve been using for the past few years “Synthetic Systems” (SS), the next version “Symmetric Synthetic Systems” (SSS), and the newest version “Systems” (S). Sorry for the confusing naming, but it’s just temporary to distinguish them from each other. We’ll settle on a final name when it’s time for regular publication.
To quantify the relative accuracy of the Synthetic Systems embodiments, here are the aggregated results of 24 semiannual test runs for each of the three from the beginning of 2010 to the middle of 2021. The numbers represent a weighted sum of 64 squared differences between the projected forecast and the actual outcome over the year following the run date, for each of the five asset classes over the combined 24 runs. So a lower number indicates greater accuracy. The raw numbers of course don’t have much intuitive meaning, but the comparisons between versions shows their relative accuracy.
SS 235.0160
SSS 174.8445
S 175.6115
As you can see, versus SS, both SSS & S represent a reduction of about 25% in aggregate forecasting error. The newest version S has the advantage of being more compact and runs in a fraction of the time of the others. The slight apparent accuracy advantage of SSS is statistically negligible, and the reduced run time for S will ultimately translate into better accuracy anyway because it will facilitate fine tuning.
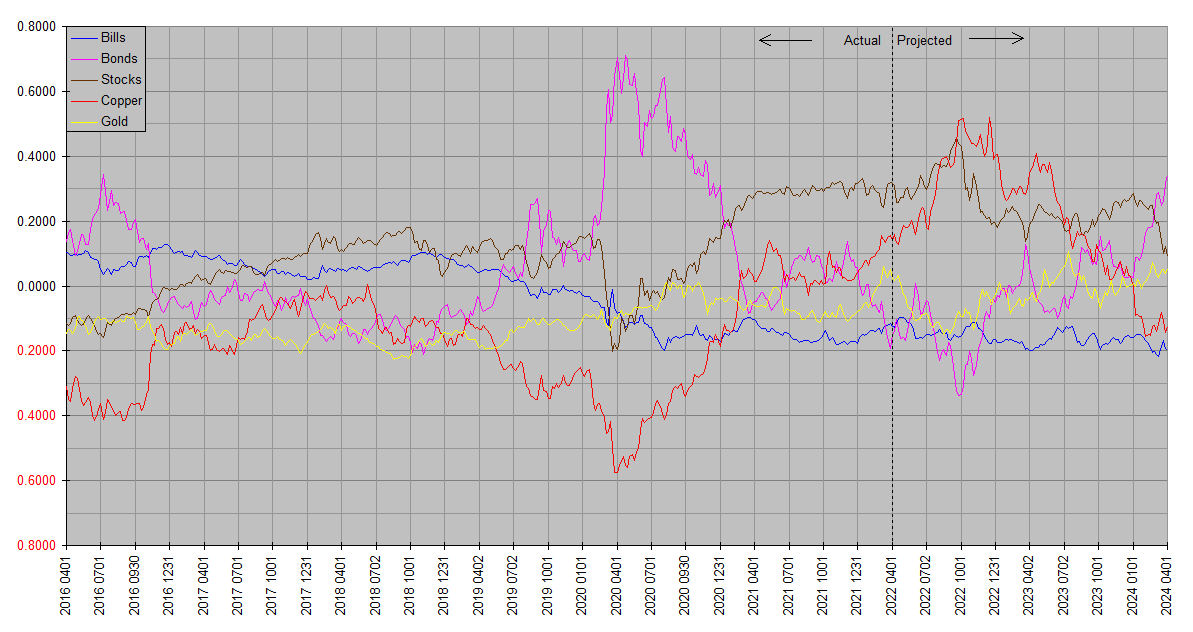
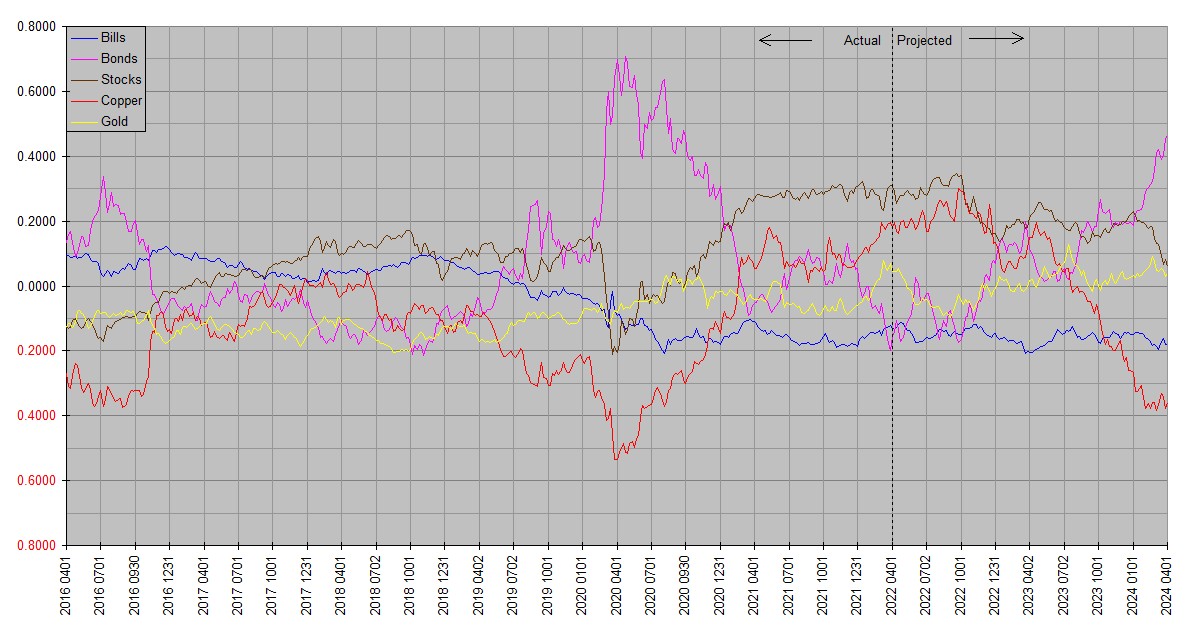
Here are the charts as of 2022.25 for each of the three versions.
SS 2022.25
SSS 2022.25
S 2022.25
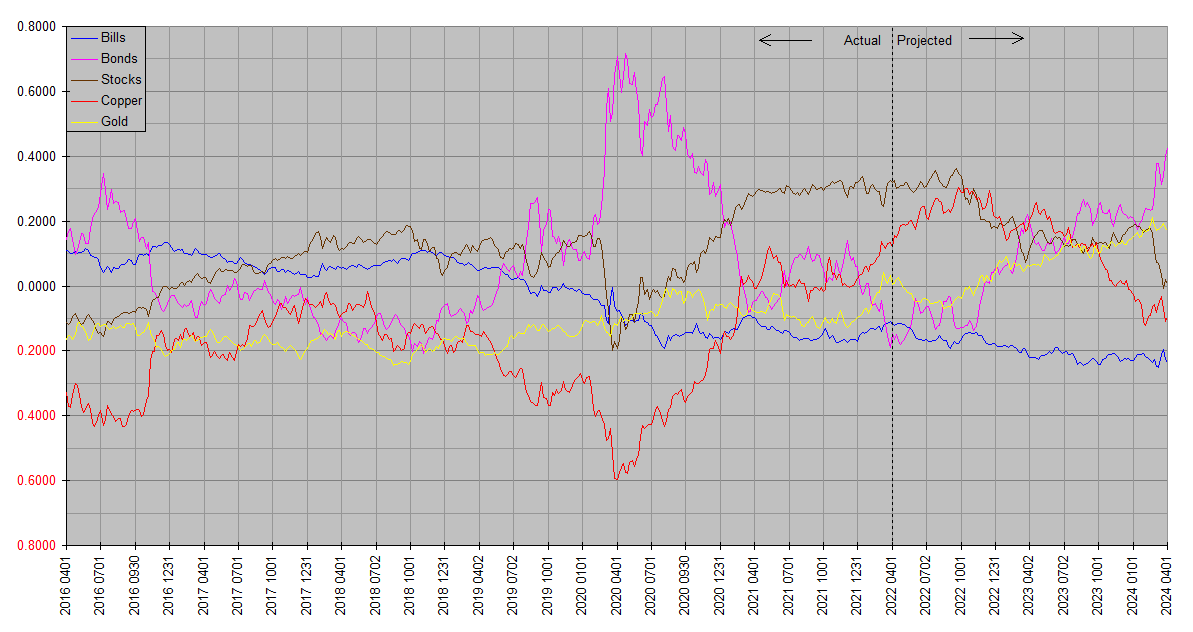
Despite their similar overall accuracy scores SSS and S vary in individual forecasts. Pending final testing, I may publish both … comparing the two can shed light on the areas of most uncertainty. As of 2022.25, however, both of these more accurate versions agree on a more moderate summer rally in stocks and copper than SS, as well as a more positive outlook for bonds. It’s for this reason that I want to call readers attention to them before the next regular update at mid year.
Both of the newer versions represent a fundamental departure from the original in that the original wasn’t intended to produce explicit market forecasts. It was designed to estimate a smoothed current rate of return for each asset class, and that was my original use for it. It became apparent that an explicit forecast was only a couple steps away though, and that that format would easier for readers to relate to without a thicket of mathy interpretation guidance. So the explicit forecast charts were practically a by-product. But the new versions are designed the other way around … they produce explicit forecasts by design, a first for Synthetic Systems.
Amazing work, Bill. Thank you.
“S” has a more positive forecast for gold than do SS and SSS. Commodities don’t take as bad of a dive, either.
Cheers Bill.
It’s so very generous of you to share all this work and knowledge with everyone.
Thank you for the comments. While focusing on the differences between the three versions of Synthetic Systems, I don’t want to give short shrift to the commonality. All three show a marked change in character around the end of the third quarter. Stocks and copper hand the baton to Treasuries and gold. More generally equities and industrial commodities to bonds and monetary commodities.
Highlighting differences in magnitude between the three versions is mainly to highlight the areas of greatest uncertainty in the forecasts. It has always been the case however that SS has been less accurate on magnitude than on timing and direction. That will continue to be the case with the newer versions; while objectively more accurate overall, they will still be better on timing and direction than on magnitude.
They will still have the same fundamental limitations as well … unable to anticipate developments arising from outside the financial and economic sphere, while nevertheless incorporating them efficiently once they leave their traces in financial and economic data. Testing highlighted this notably in 2020 … the accuracy of the run done at the beginning of 2020 – the last before the Covid shutdowns – was abysmal, while that of the run done at the middle of that year was at least as good as typical. Generally allow a full calendar quarter for assimilation, with S being a bit quicker than SSS while the latter is a bit more stable.
bill, i take your work quite seriously. thanks again for sharing it.
On behalf of myself and readers, thanks for your comments, questions and insights, JK.